Kikuyugrass only grows within 20 miles of the California coast
Kikuyugrass has one of the most geographically restricted ranges of any turfgrass in the continental United States. I mapped its distribution, showing this grass thrives almost exclusively within a narrow 20-mile strip along the California coast. This unique boundary is defined by specific coastal climate conditions.
Verifying kikuyugrass locations
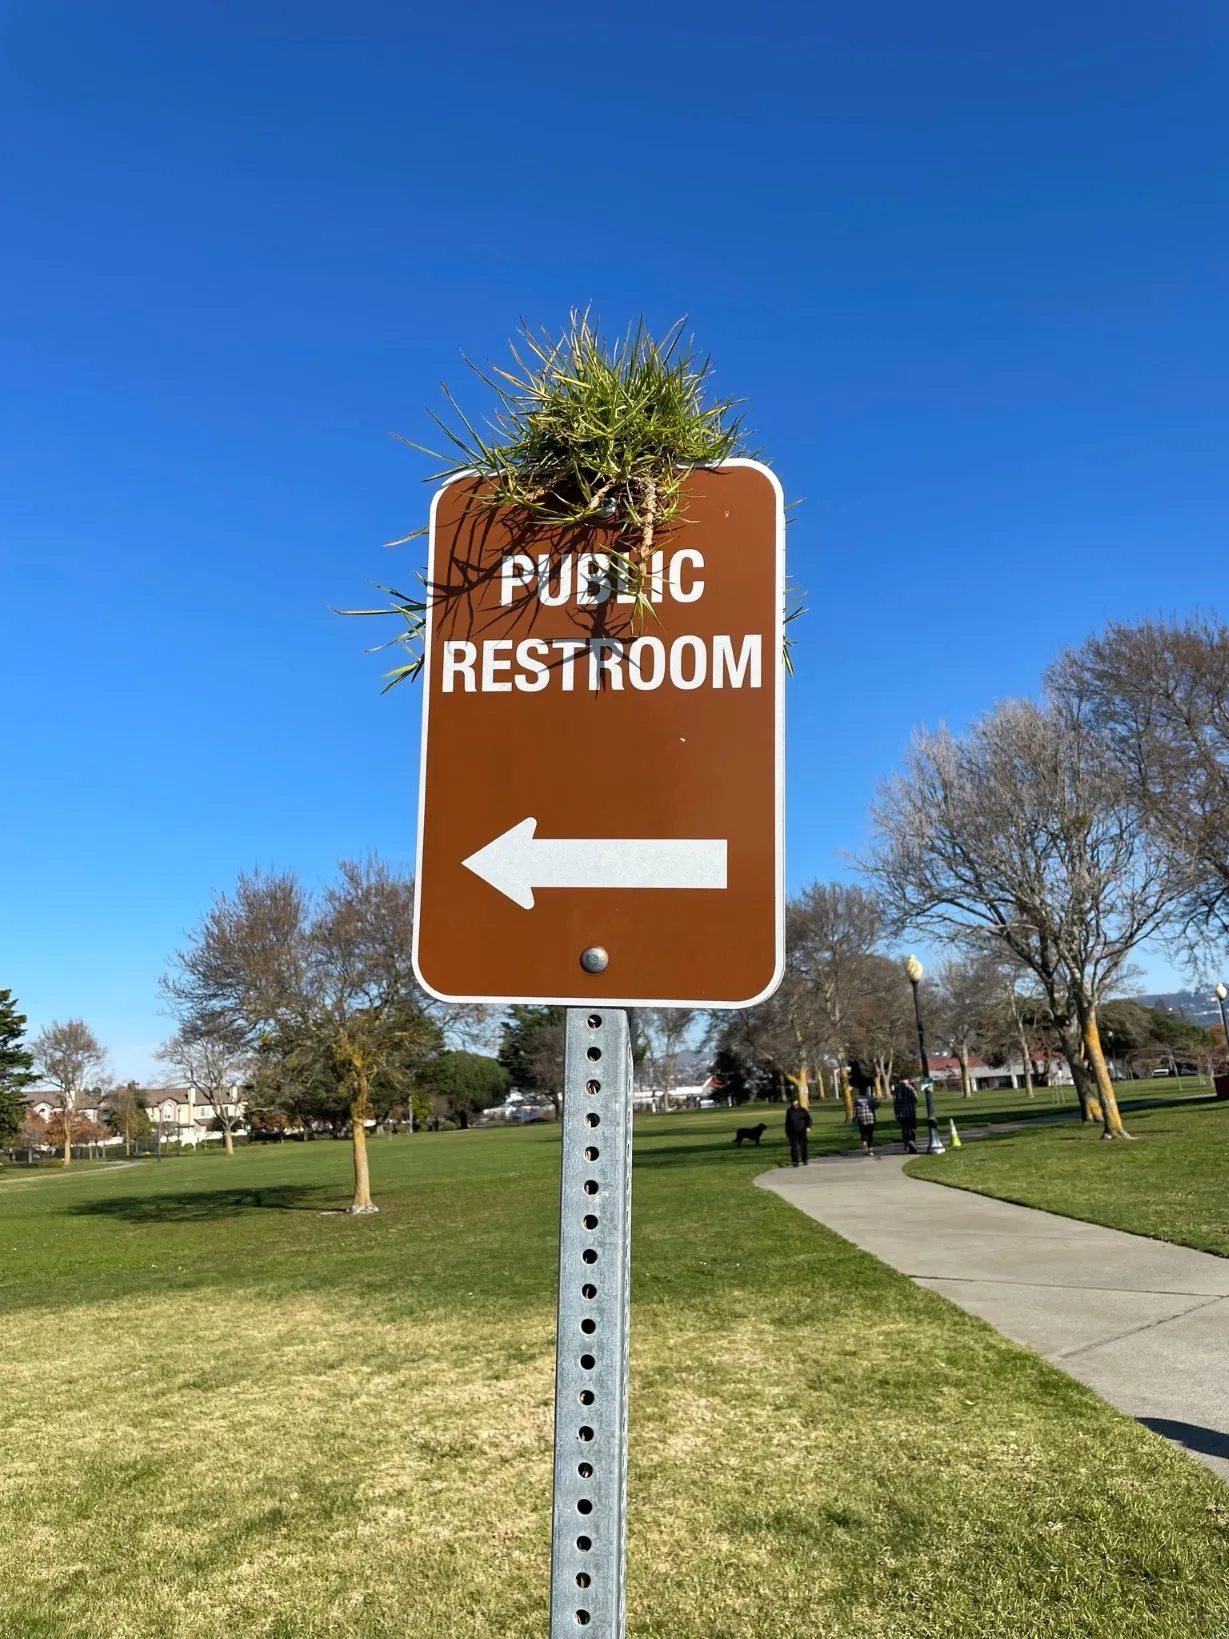
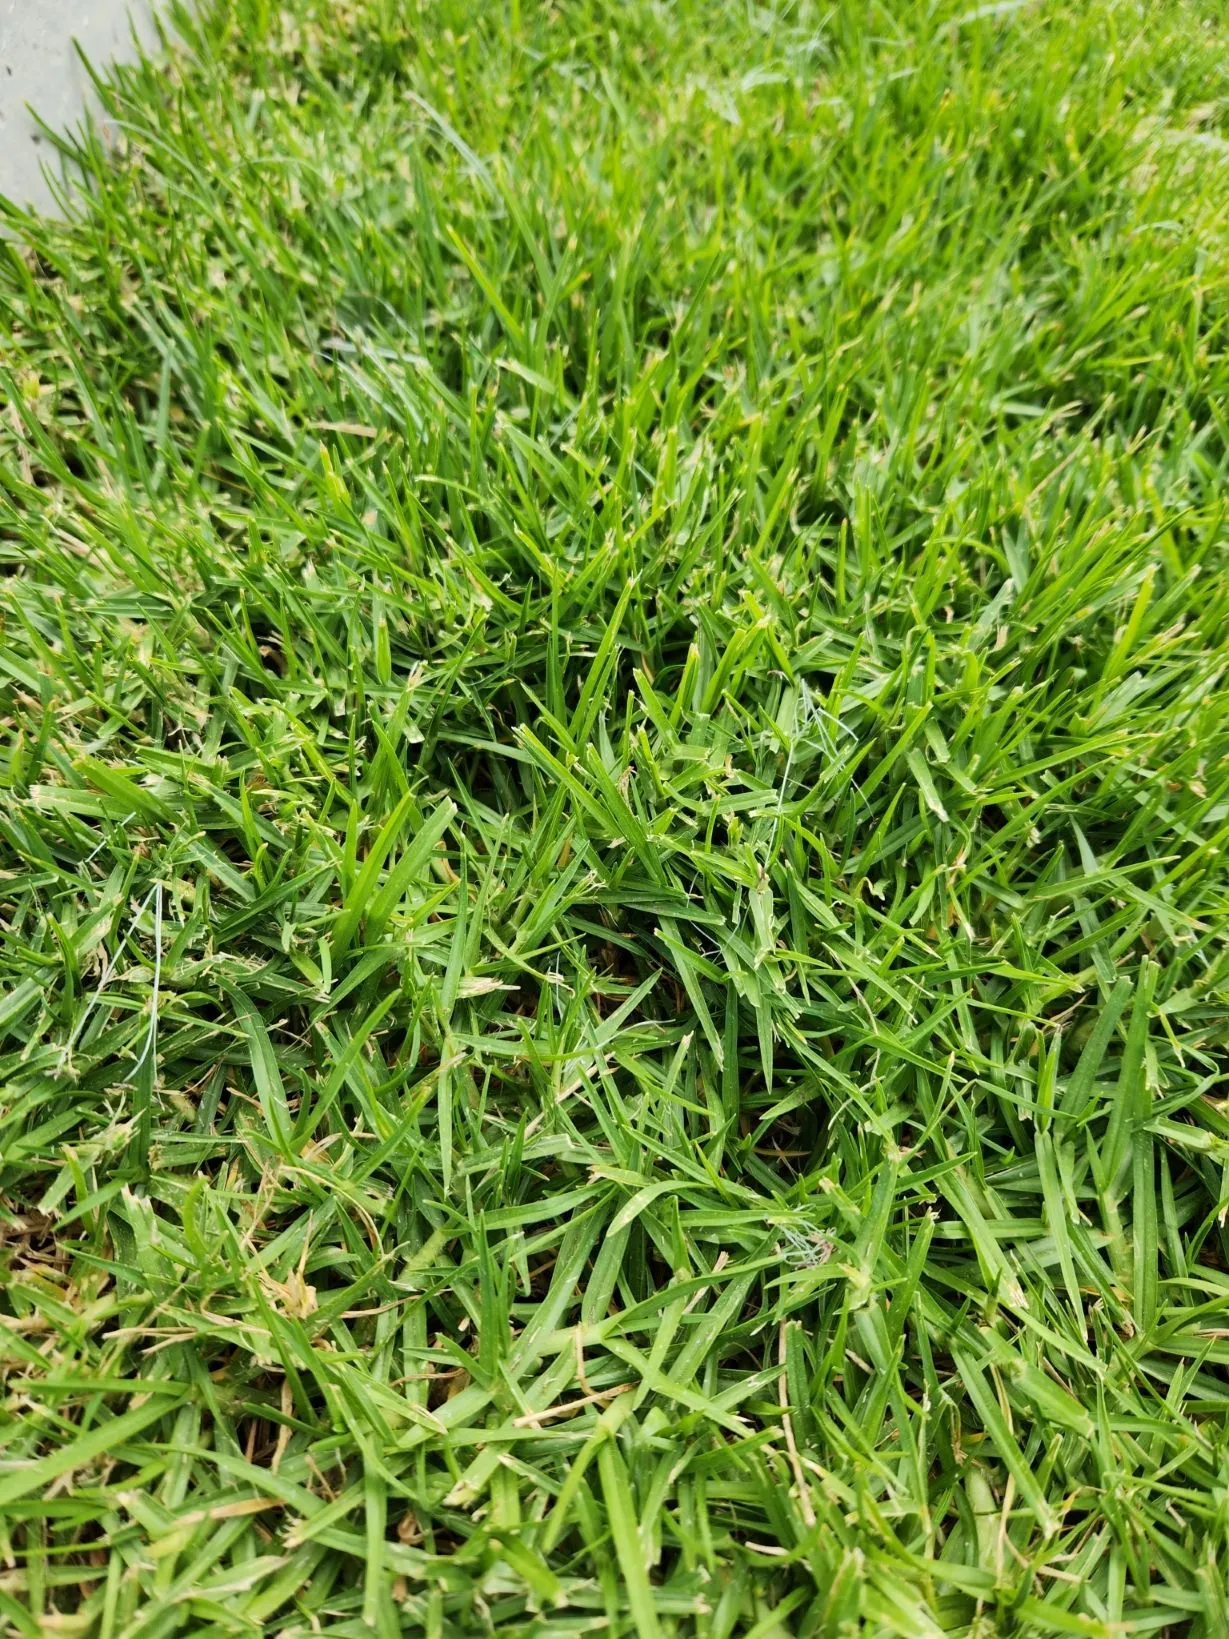
High-quality data of kikuyugrass (Cenchrus clandestinus) observations came from iNaturalist. I used the iNaturalist API to pull any record of kikuyugrass with a location and image. I manually reviewed each image to verify the identification. Here are a couple of the great images people have shared.
I found 358 genuine kikuyugrass observations in the iNaturalist records. About a quarter of the images turned out to be something else, like St. Augustinegrass. Another 22% of the images were too tough to call—they were lower resolution or not close enough to identify the grass.
Looking at each point plotted on a map, we can already see that kikuyugrass locations are clustered along the coast. The observations are particularly concentrated in the Bay Area, Los Angeles, and San Diego.

Subscribe for updates
Top climate factors
I used maximum entropy (MaxEnt) modeling to identify where kikuyugrass could potentially grow based on climate. The model works by finding locations with similar environmental characteristics to places where kikuyugrass is already known to persist.
To build the map for California, I used the 358 verified kikuyugrass locations from iNaturalist and a set of 19 climate variables from the WorldClim global climate database. The climate variables are described in the table below. All are derived from temperature and rainfall.
| Variable | Name | Explanation |
|---|---|---|
| bio1 | Annual mean temperature | Average temperature across the entire year |
| bio2 | Mean diurnal range | Average temperature swing within a day (difference between daily high and low) |
| bio3 | Isothermality | Ratio daily temperature differences compared to annual temperature differences (bio2/bio7) |
| bio4 | Temperature seasonality | How much temperature varies month-to-month |
| bio5 | Max temperature of warmest month | Highest temperature reached in hottest month |
| bio6 | Min temperature of coldest month | Lowest temperature reached in coldest month |
| bio7 | Temperature annual range | Total temperature swing across year (bio5-bio6) |
| bio8 | Mean temperature of wettest quarter | Average temperature during wettest 3-month period |
| bio9 | Mean temperature of driest quarter | Average temperature during driest 3-month period |
| bio10 | Mean temperature of warmest quarter | Average temperature during hottest 3-month period |
| bio11 | Mean temperatures of coldest quarter | Average temperature during coldest 3-month period |
| bio12 | Annual precipitation | Total rainfall over entire year |
| bio13 | Precipitation of wettest month | Total rainfall in wettest month |
| bio14 | Precipitation of driest month | Total rainfall in driest month |
| bio15 | Precipitation seasonality | How much rainfall varies throughout year (coefficient of variation) |
| bio16 | Precipitation of wettest quarter | Total rainfall during wettest 3-month period |
| bio17 | Precipitation of driest quarter | Total rainfall during driest 3-month period |
| bio18 | Precipitation of warmest quarter | Total rainfall during hottest 3-month period |
| bio19 | Precipitation of coldest quarter | Total rainfall during coldest 3-month period |
The trained model can distinguish between suitable and unsuitable kikuyugrass habitat. This means the model performed well with an AUC around 0.91. Two climate variables turned out to be the most influential in defining kikuyugrass range:
bio10Temperature of the warmest quarterbio7Annual range of temperature
Within California, kikuyugrass has a strong preference for areas with cooler summers and less temperature variation throughout the year. A coastal climate.
Mapping kikuyugrass suitability
This model can be used to predict how suitable different areas of California are for kikuyugrass. The model assigns each map area a value between 0 and 1, where higher values are more suitable. The resulting map shows where environmental conditions favor kikuyugrass.


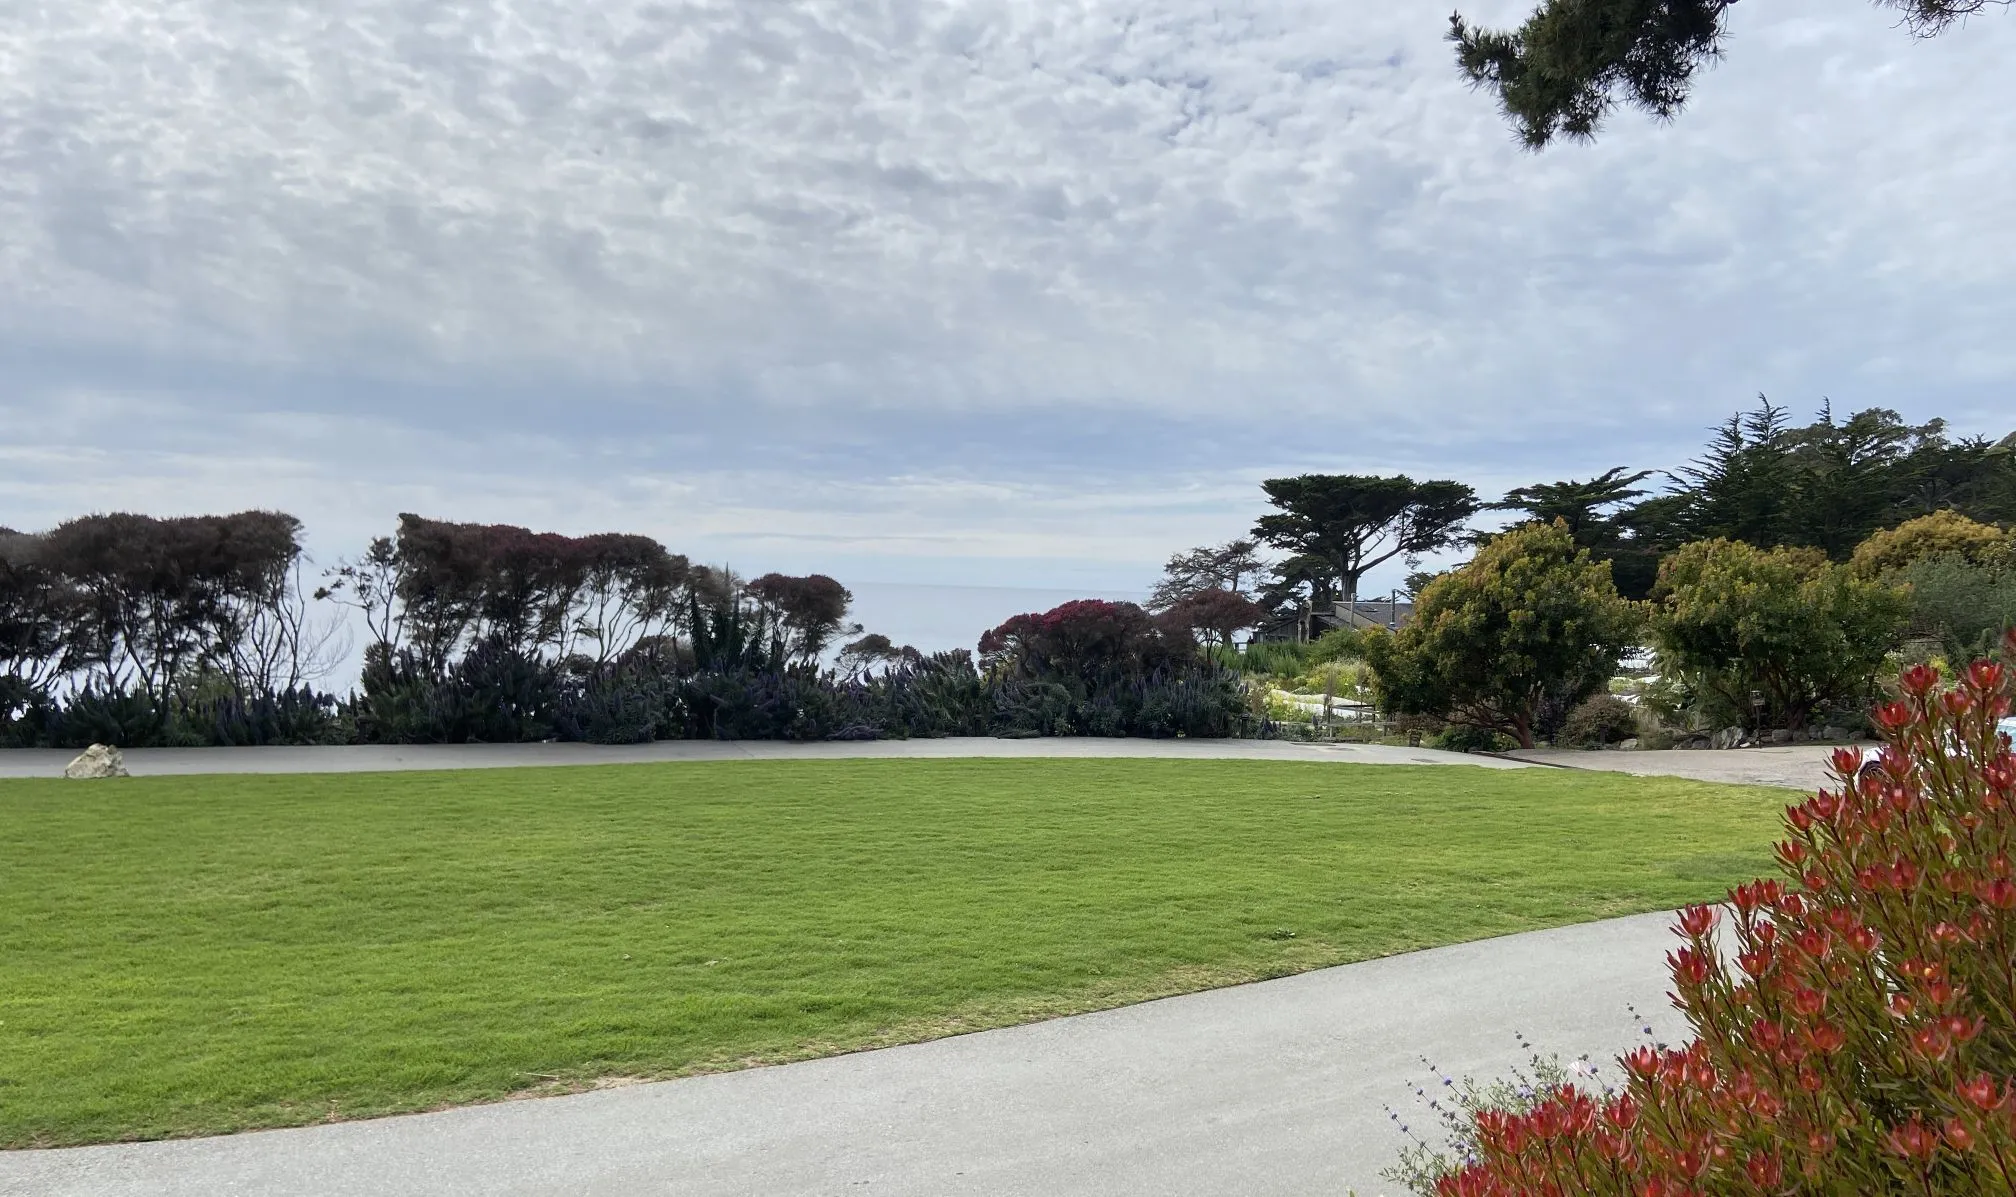
This makes sense. Kikuyugrass thrives in a narrow 20-mile coastal strip, from the Bay Area to the state’s southern border. Interestingly, there’s a big blank spot in Big Sur, near the center of the coastline. Big Sur’s coastal location seems ideal for kikuyugrass. If there is a lawn in Big Sur, it’s probably kikuyugrass, like the one pictured below.
I took a deeper look at the climate data and found that compared to areas just north and south, Big Sur gets significantly more annual rainfall (8 more inches) and experiences more variable temperatures throughout the year. There’s also very limited human development in the region. There are few people or maintained turfgrass areas, and there were no kikuyugrass records from here in the iNaturalist dataset. The distinct climate and sampling bias likely explains why Big Sur doesn’t show up as suitable habitat on the map.