Predicting golf shoe damage to putting surfaces
I gave this presentation a few weeks ago at the 2025 International Turfgrass Research Conference in Japan, about predicting golf shoe damage to putting surfaces using machine learning. This research was conducted in collaboration with Cornell and was published in the International Turfgrass Society Research Journal.
Our work shows that damage from golf shoes can be moderately predicted if the walker identity and type of footwear are known. Weather variables or surface firmness are not meaningful predictors of surface disruption. This means we have no clear answer on what superintendents can manage to prevent golf shoe damage, but we have new ideas about how to predict this.
This annotated version of my slides is inspired by Hamel Husain’s annotated presentations.
Slide 1
This talk is about how walking traffic, golfer footwear, and environment interact on the putting surface. The full paper is open access, read it here.
Slide 2
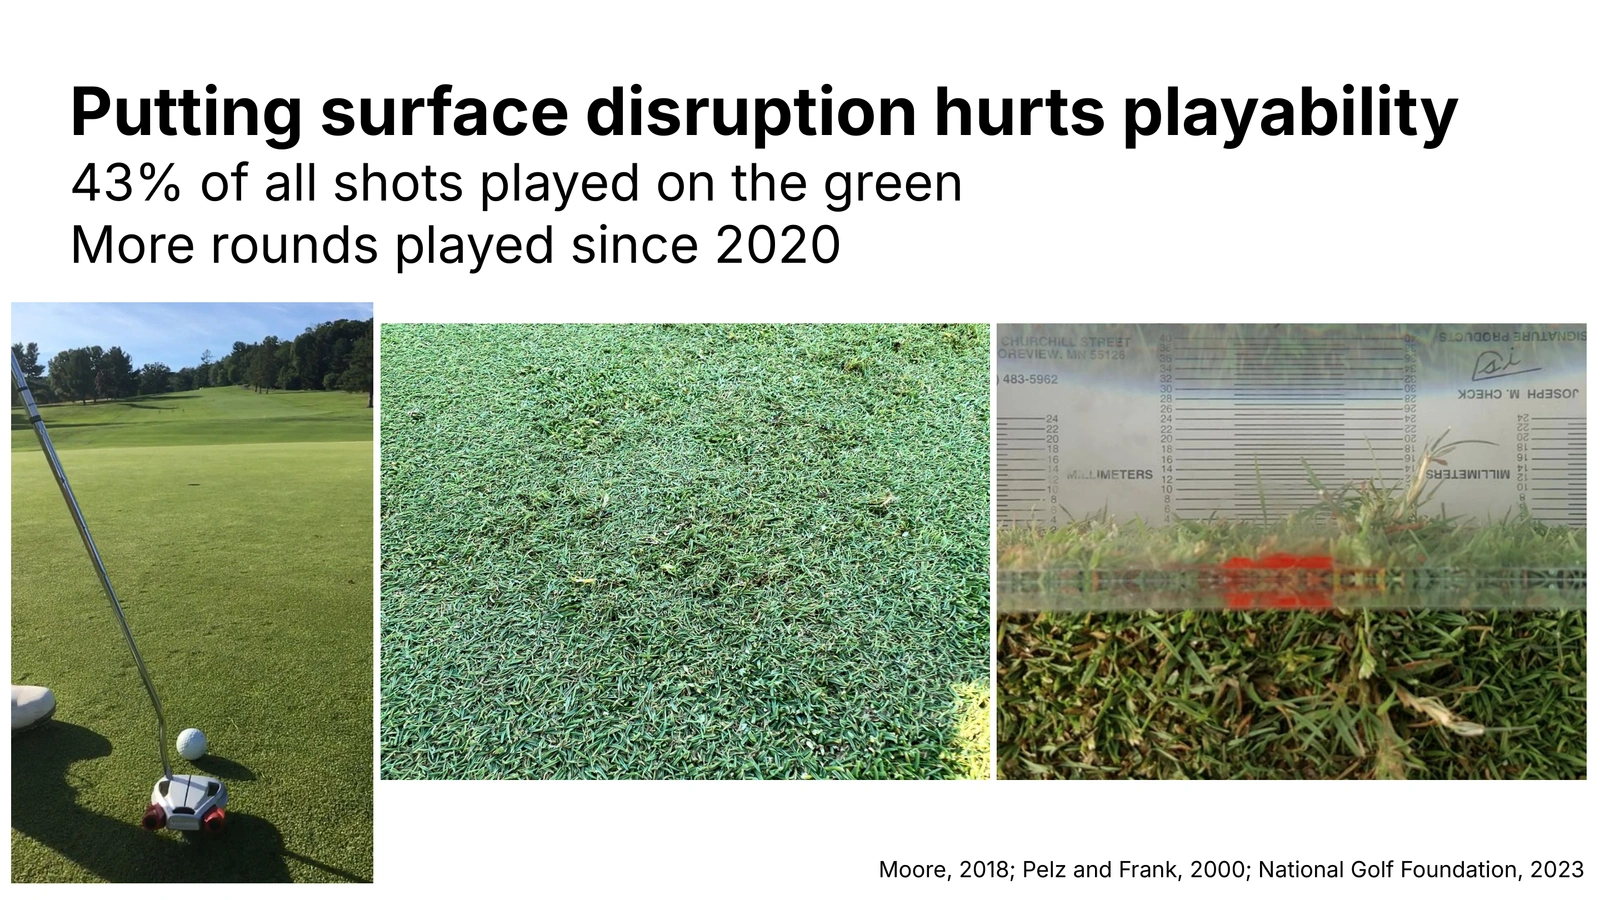
Putting surface disruption is a playability issue. These images show how golf shoe scuffing on the green creates an uneven surface that will affect ball roll. About 43% of all golf shots are played on greens, and golf participation has increased significantly since 2020, putting more pressure on putting surfaces.
Slide 3
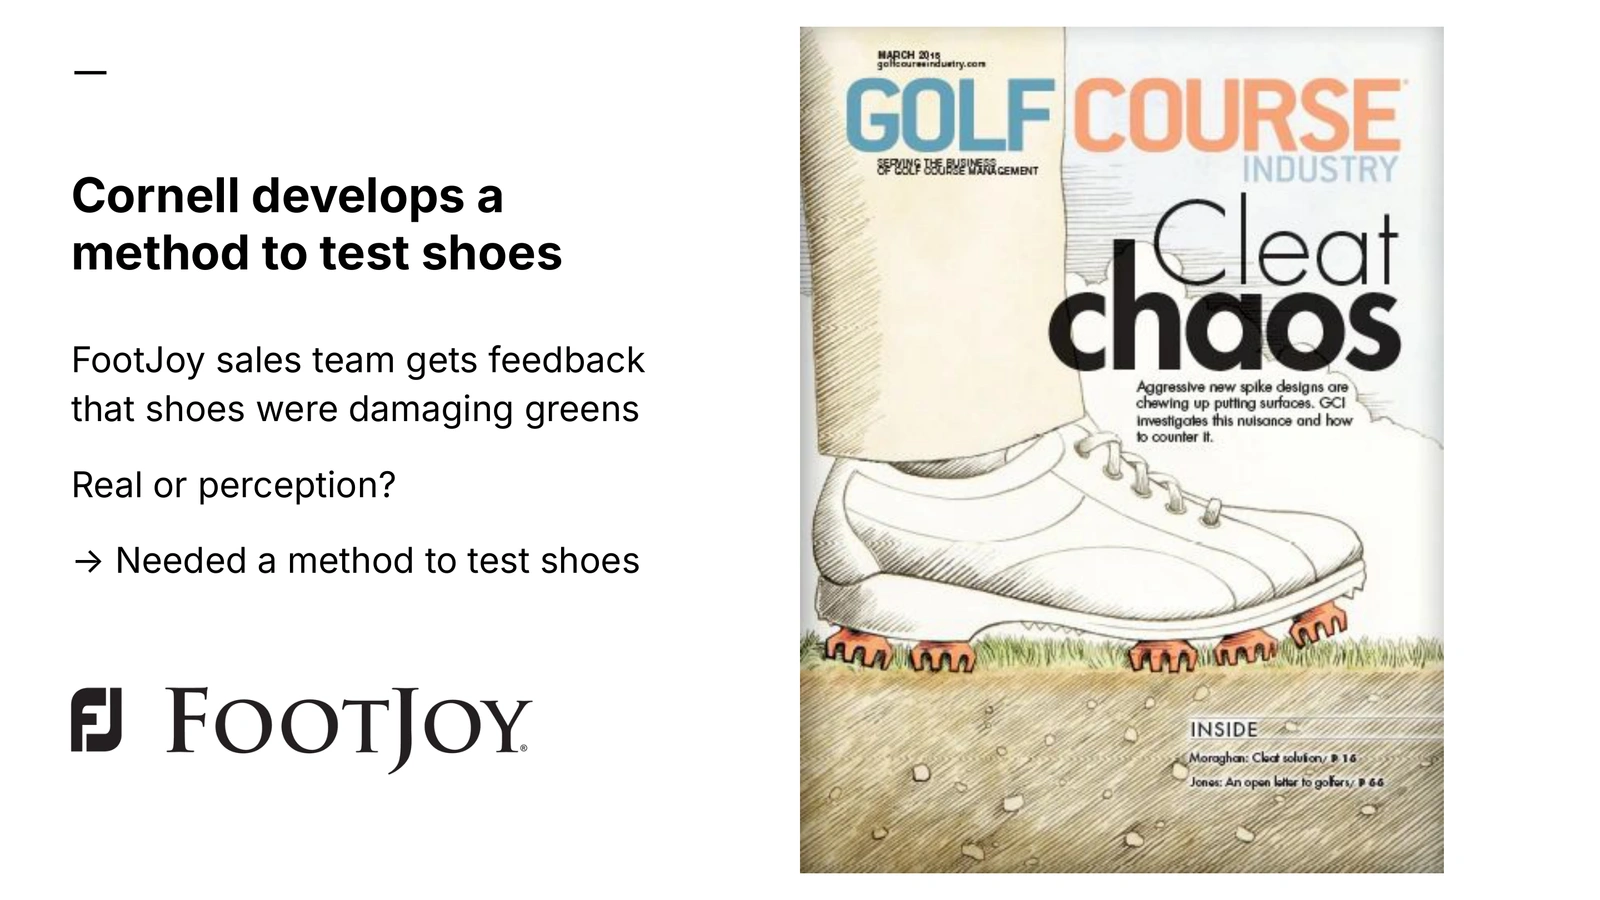
This is a Golf Course Industry magazine cover story called Cleat Chaos, and says “Aggressive new spike designs are chewing up putting surfaces.” Around the time this story was published, companies like FootJoy were getting feedback that their golf shoes were damaging greens. FootJoy was motivated to understand if this was a real problem or if this was golfer perception. They needed a method to test shoes, and came to Cornell to develop a method for testing golf shoe impacts to putting green turfgrass. The Cornell group designed a protocol to do this.
Slide 4
The footwear testing protocol looks like this. Plots were 10 feet by 10 feet, because the area within 10 feet of the hole is where traffic is most concentrated. This walker is wearing a pair of golf shoes, walking to and from the center of this plot to points around the perimeter, until desired number of steps are applied. The walking pattern around a center point simulates wear from golf played, with straight-line and turning traffic. Previous work (by others) figured out a step count that was representative of actual golf rounds, and the Cornell team developed this walking pattern around the hole. This approach lets us apply traffic in a repeatable way.
Slide 5
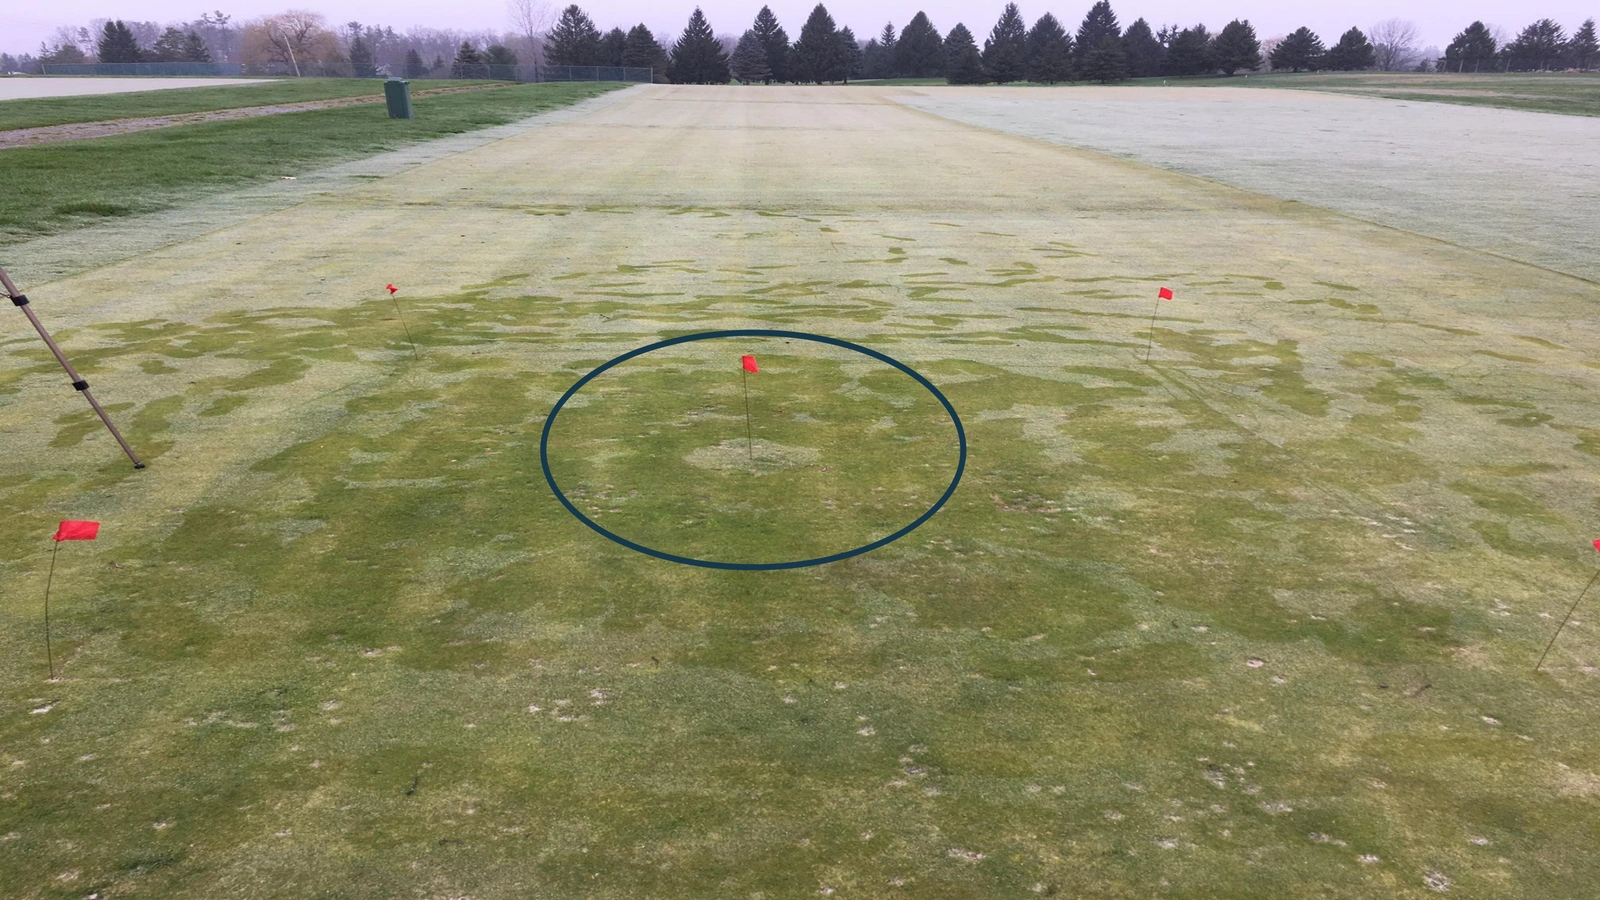
This image shows the result of 1 walking lap. This pattern replicates density of foot traffic seen in real play, with steps more concentrated around the hole and less concentrated further away from the hole.
Slide 6
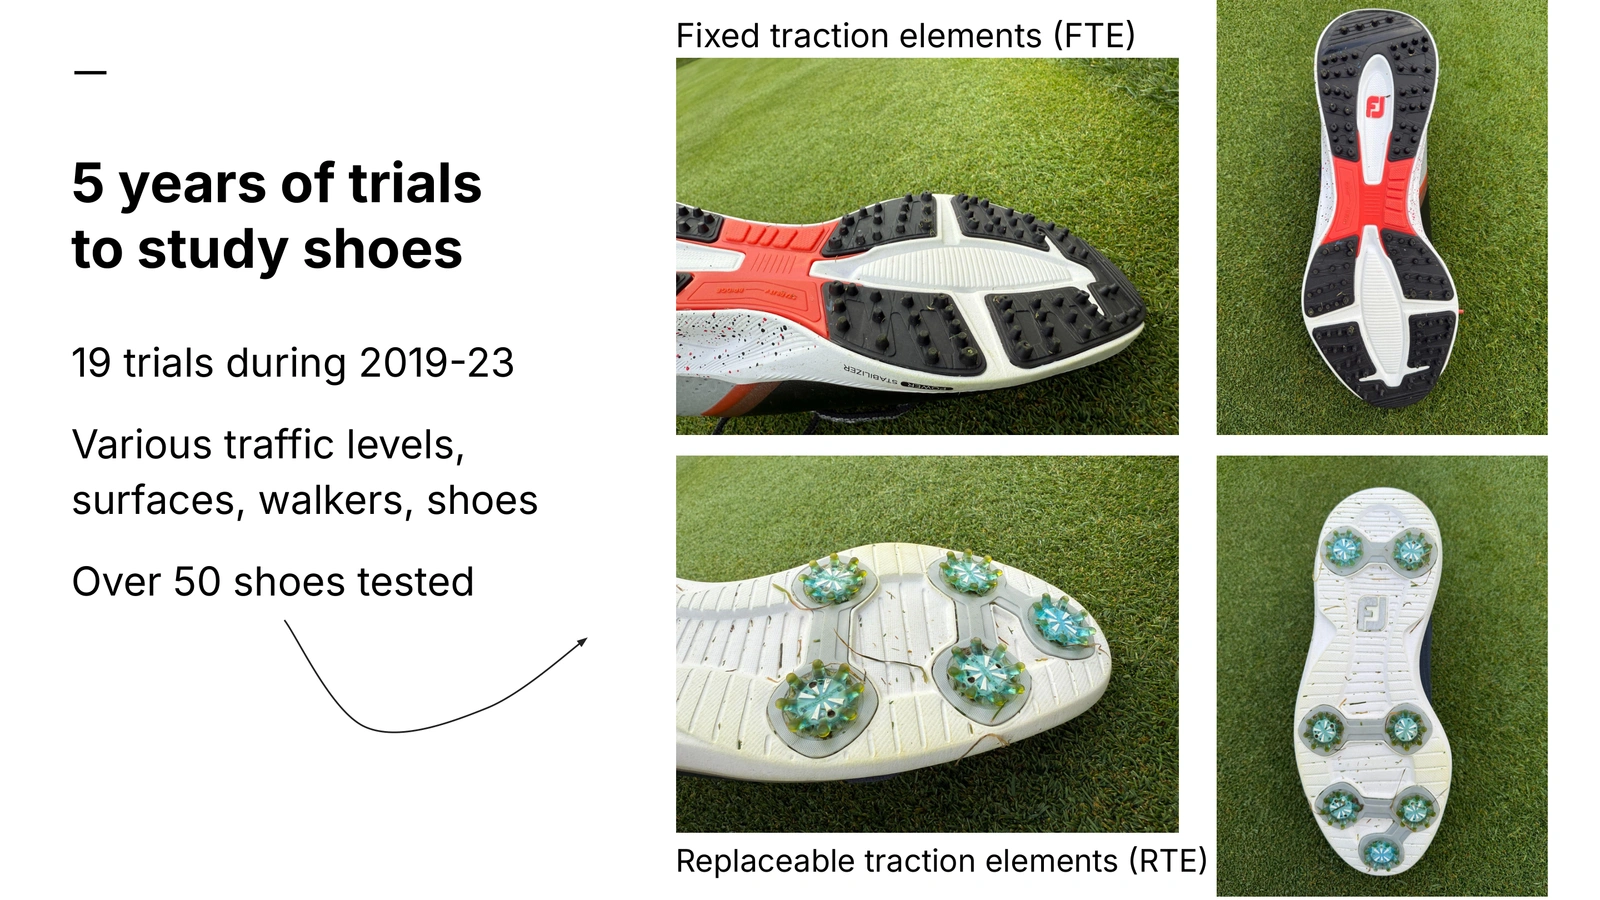
Over 5 years, Cornell conducted 19 trials testing more than 50 different golf shoes with different walkers, grass types, traffic levels, and times of year. These trials were located at Cornell University Turfgrass and Landscape Research Center in New York. Outcomes measured were the impacts to ball roll distance and visual rating of traffic damage. All the data was compiled into a database for a machine learning model.
Footwear tread type was categorized into 3 types. Fixed traction element (FTE) designs lack removable elements, often termed “spikeless.” Replaceable traction element (RTE) designs, commonly known as “spiked,” have removable traction elements. The images show examples of each type.
Slide 7
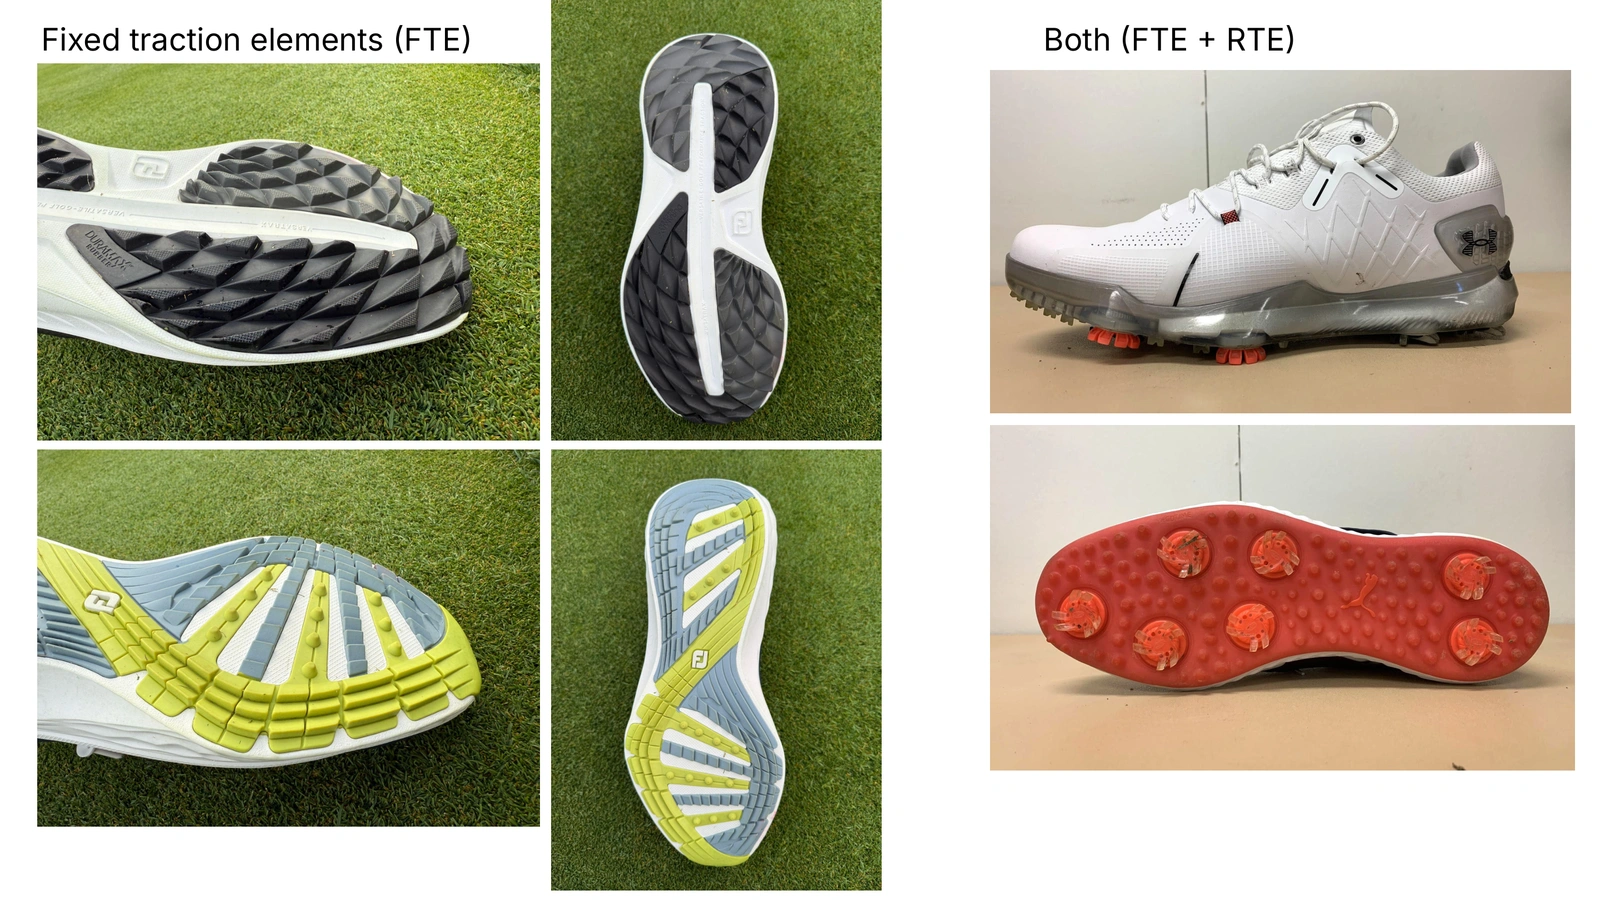
These images show more examples of FTE (spikeless) shoes. There are also hybrid shoes that combine both fixed and replaceable elements (FTE + RTE).
Slide 8
Initial work focused on evaluating different shoes, but we’ve got years of data lying around that could answer a broader question: which factors most influence surface disruption? We hypothesized that it was the shoes, of course, but also that weather and surface properties, such as firmness, were important.
Slide 9
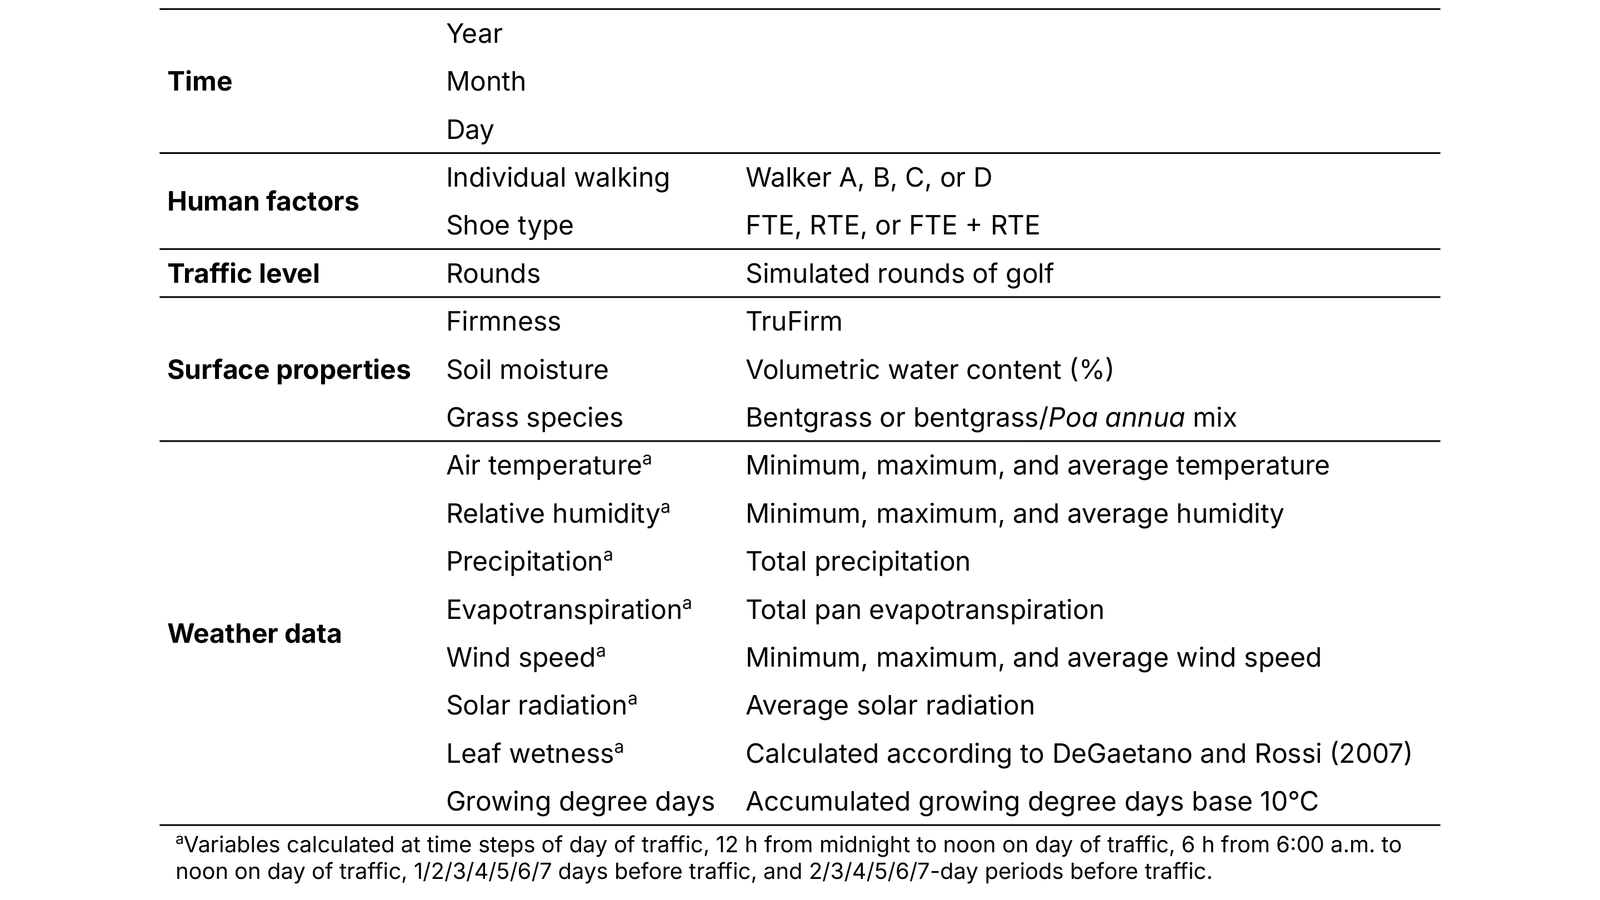
We included 115 predictor variables (features) in our models, and the features can be grouped into five categories:
- Time: year, month, day of year
- Human factors: human walking, their shoe tread type
- Traffic level: simulated number of golf rounds
- Putting surface properties: firmness, soil moisture, grass species
- Weather data: air temperature, humidity, precipitation, evapotranspiration, wind speed, solar radiation, accumulated growing degree days, and leaf wetness
Each weather variable (except GDD) was measured in multiple windows of time prior to traffic treatments and data collection: day-of-traffic; 6 hours the morning before; 12 hours over the night before; each of the previous 7 days; and running totals or averages over previous 2 to 7-day periods.
Slide 10
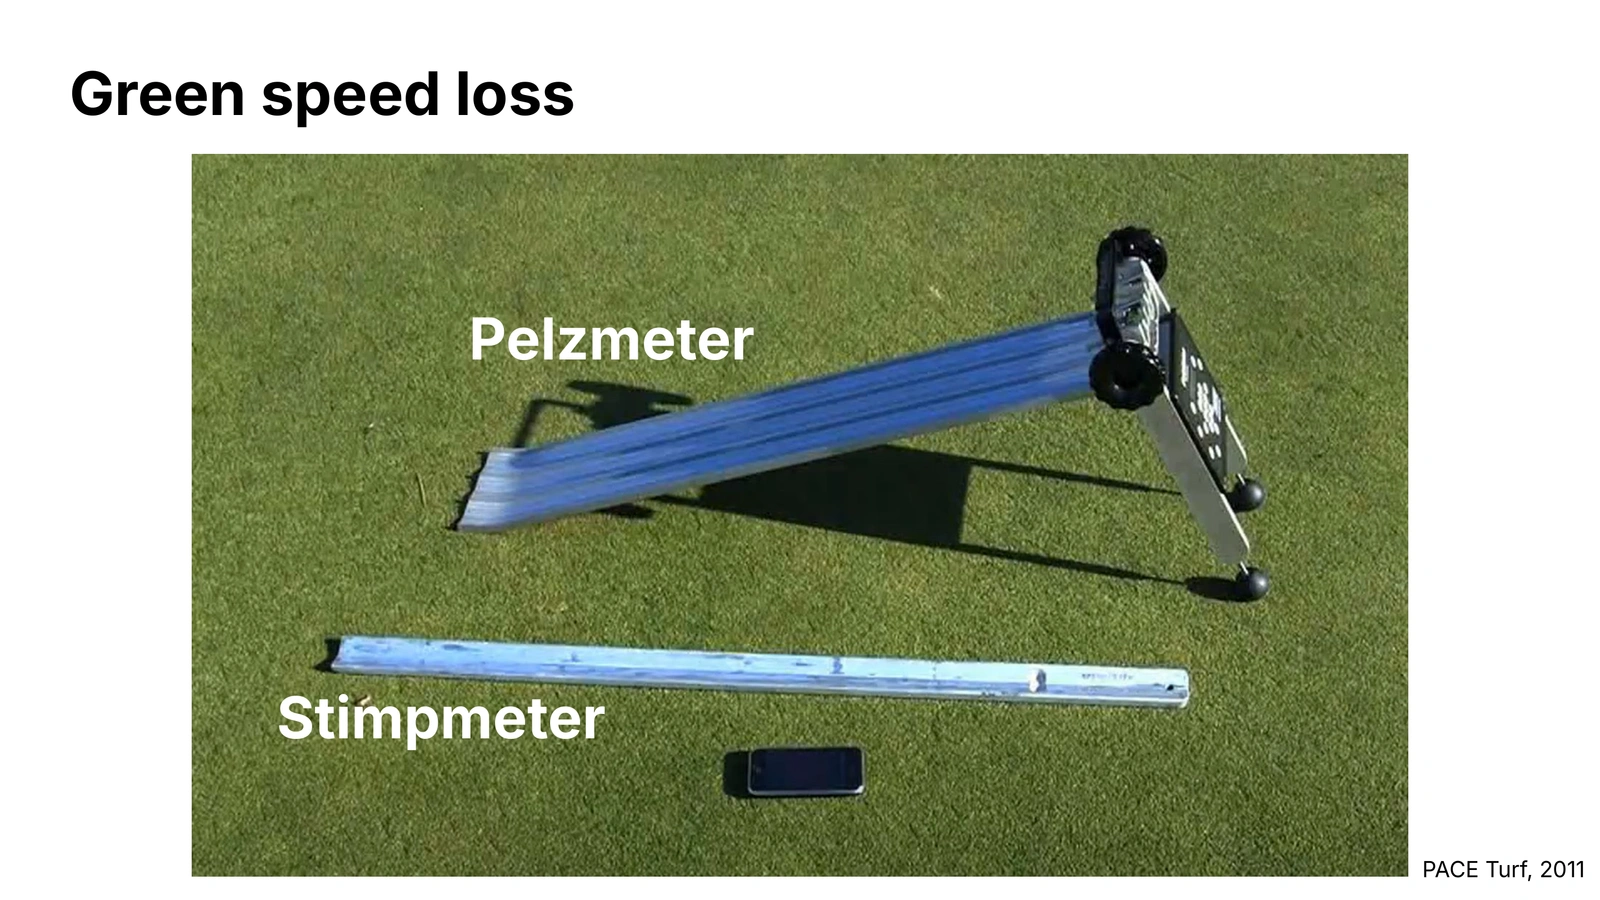
We measured putting surface outcomes using two methods. First, the Pelzmeter to measure ball roll distance. The Pelzmeter is comparable to the USGA Stimpmeter, seen together here.
Slide 11
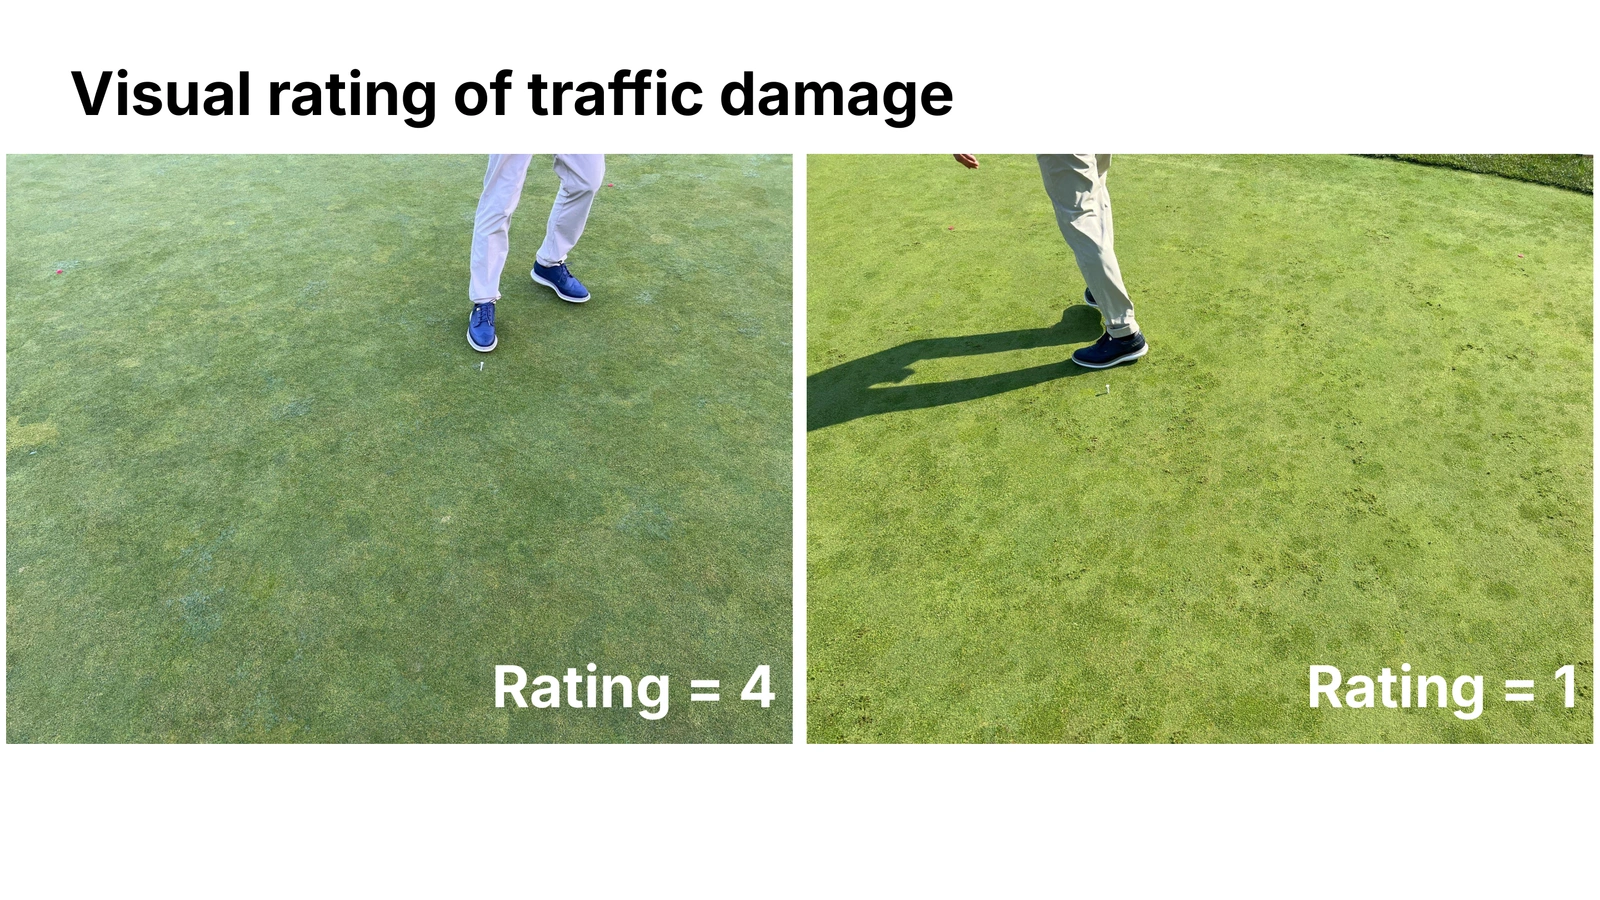
Second, we used a visual assessment to rate traffic damage on a 1-5 scale, with 1 being the most damaged. These images show what a 1 and a 4 rating look like.
Slide 12
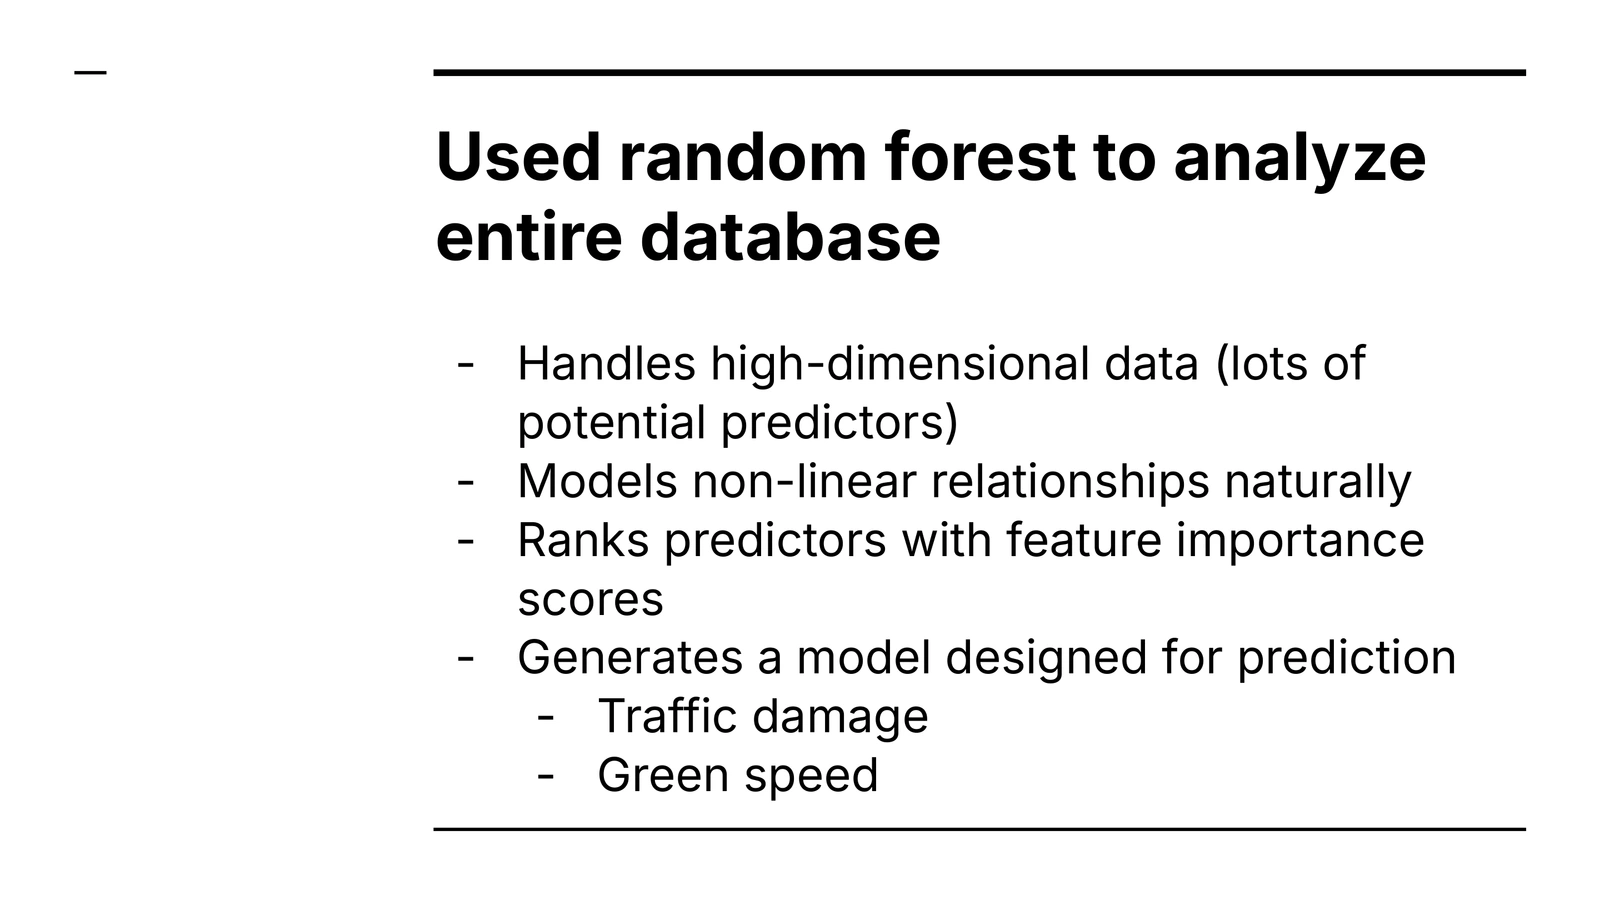
We used random forest to analyze the entire database. We wanted to generate models we could use for prediction on any given day.
Slide 13
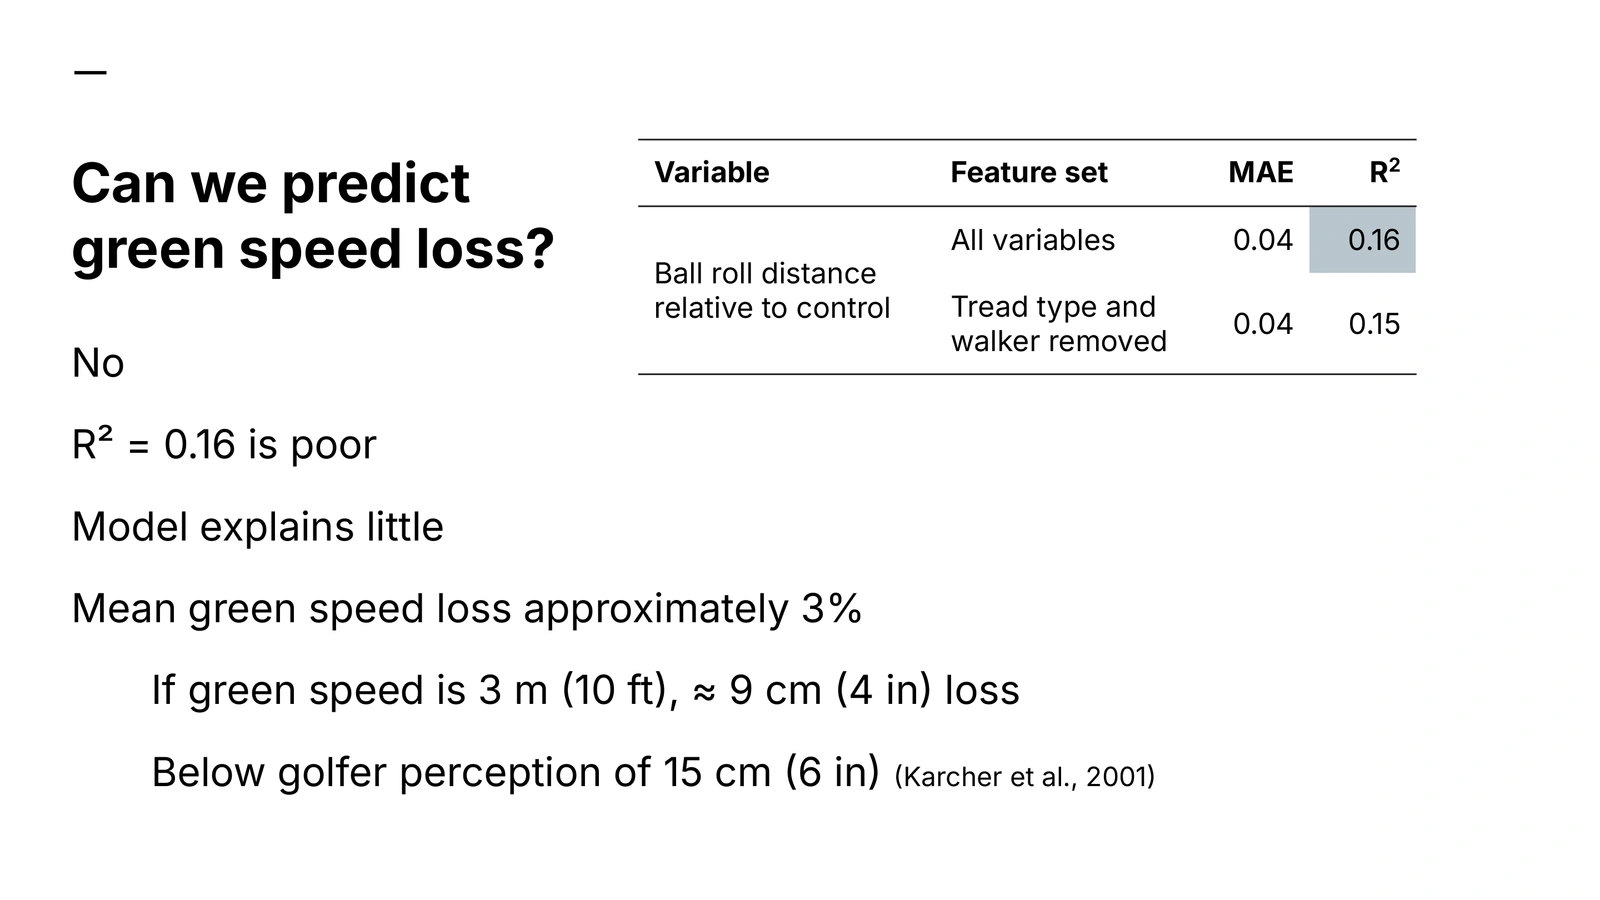
We set up a random forest model to predict ball roll distance relative to control (green speed loss RTC). Two versions of this model were tested, one with all 115 features listed above (weather, putting green surface traits, walker id, shoe type, etc.) and one with a smaller feature set excluding shoe type and walker. The idea was to remove factors superintendents cannot control or easily measure. We figured it would be difficult for a superintendent to collect daily data about golfers and what shoes they are wearing.
Can we predict green speed loss? No, R² = 0.16 means the model explains little, it’s barely better than guessing the mean. Removing tread type and walker does not do much because they never explained the variance to begin with. The overall average loss of ball roll distance, of all plots that received traffic, was around 3%. This would be about 3-5 inches shorter green speeds, and research shows golfers can only perceive about a 6-inch difference in green speed. In practice, golfers would not feel that difference!
Slide 14
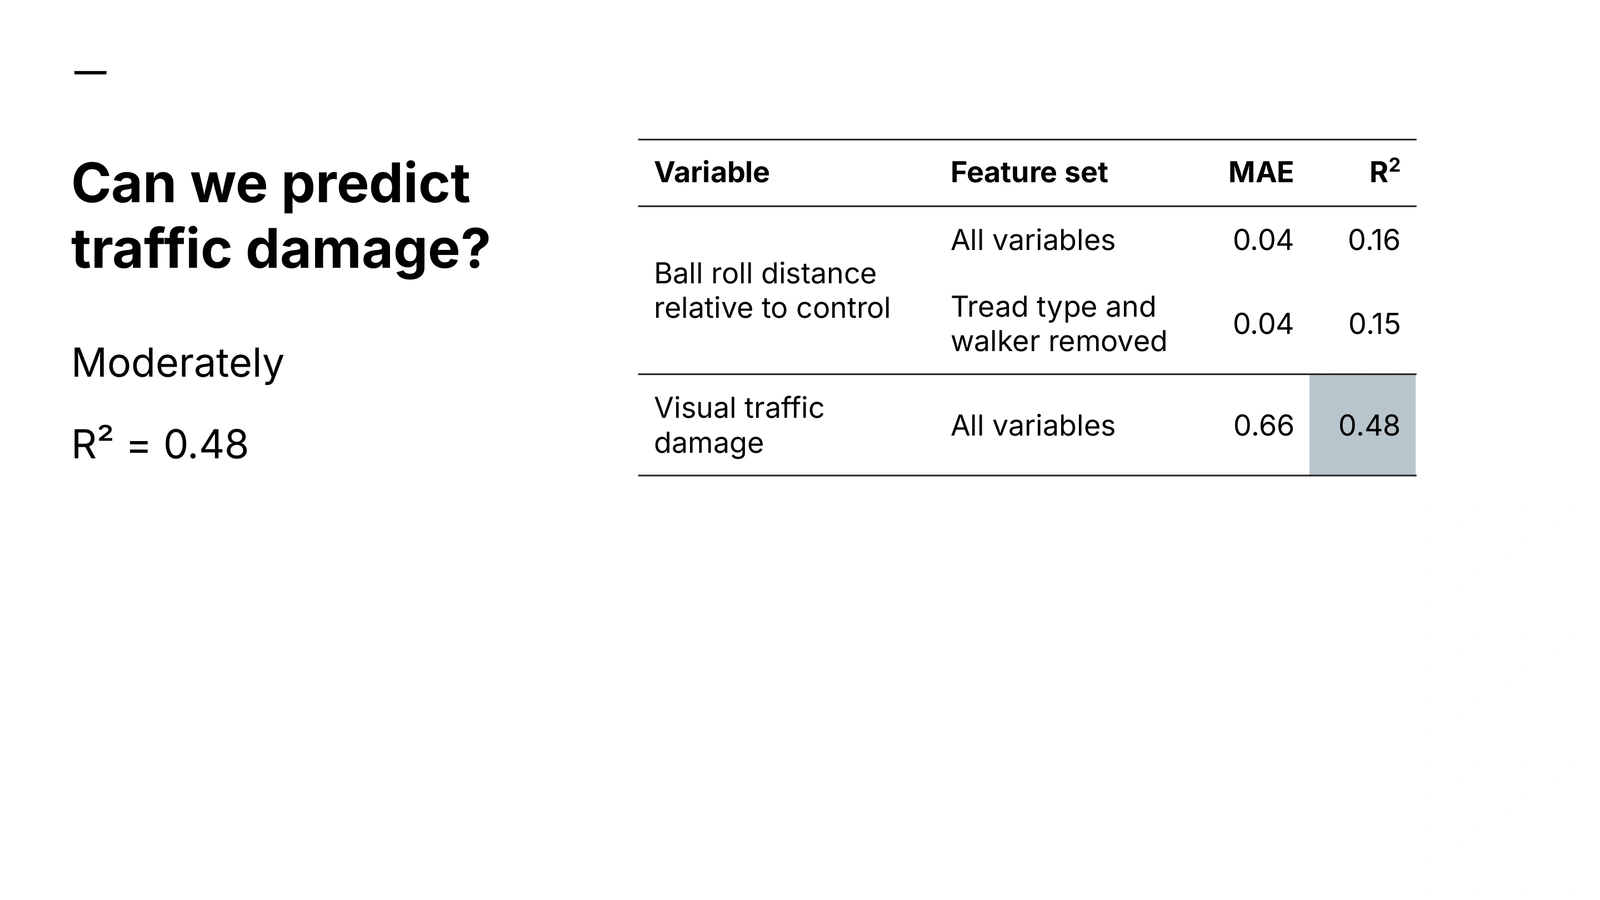
Can we predict visual traffic damage? Remember this is visual rating on a 1 to 5 scale. The full model with all variables has a MAE = 0.66 and R² = 0.48. This is moderately predictive. The full model can explain about half of the variation in the damage score, and on average it misses by 0.66 of a rating point. This relies on knowing the walker and shoe.
Slide 15
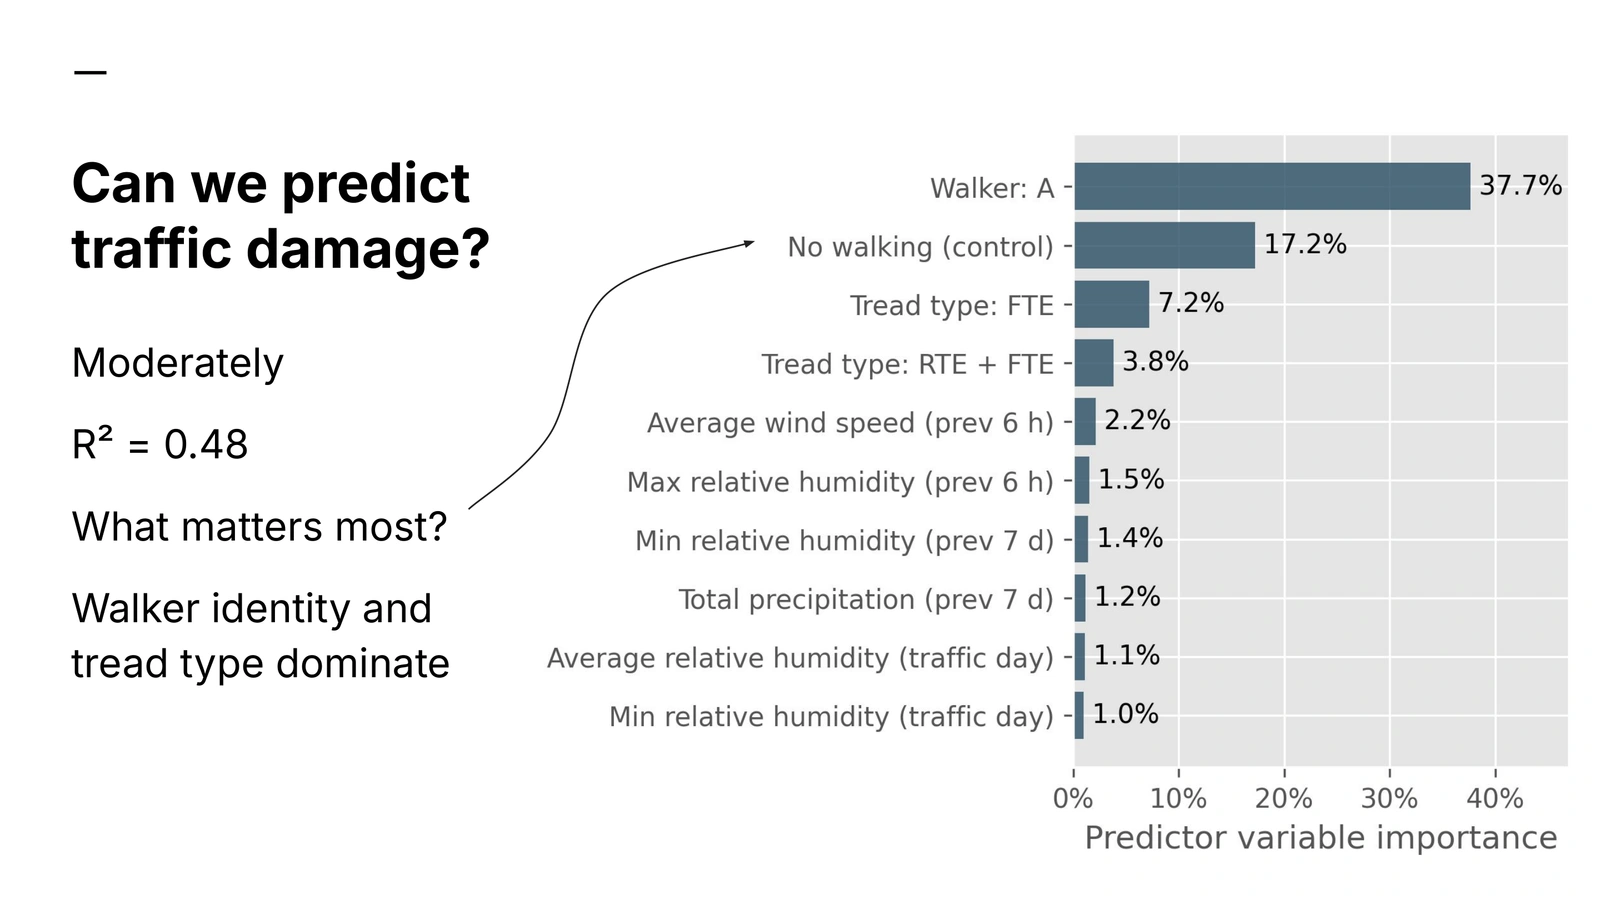
The bar chart shows the top 10 features to predict visual damage. Note this is the strength of a feature, it doesn’t tell us the impact is good or bad. We one-hot encoded each categorical variable. Two walker features + two shoe features account for 65% of the feature importance scores. No walking control is obviously going to be impactful, this means the plot was undisturbed and there was no damage.
If we zoom out, the tallest bars are the walker identity, then shoe tread. Weather is minor. Who is walking and what’s on their feet matter far more than environmental factors.
Slide 16
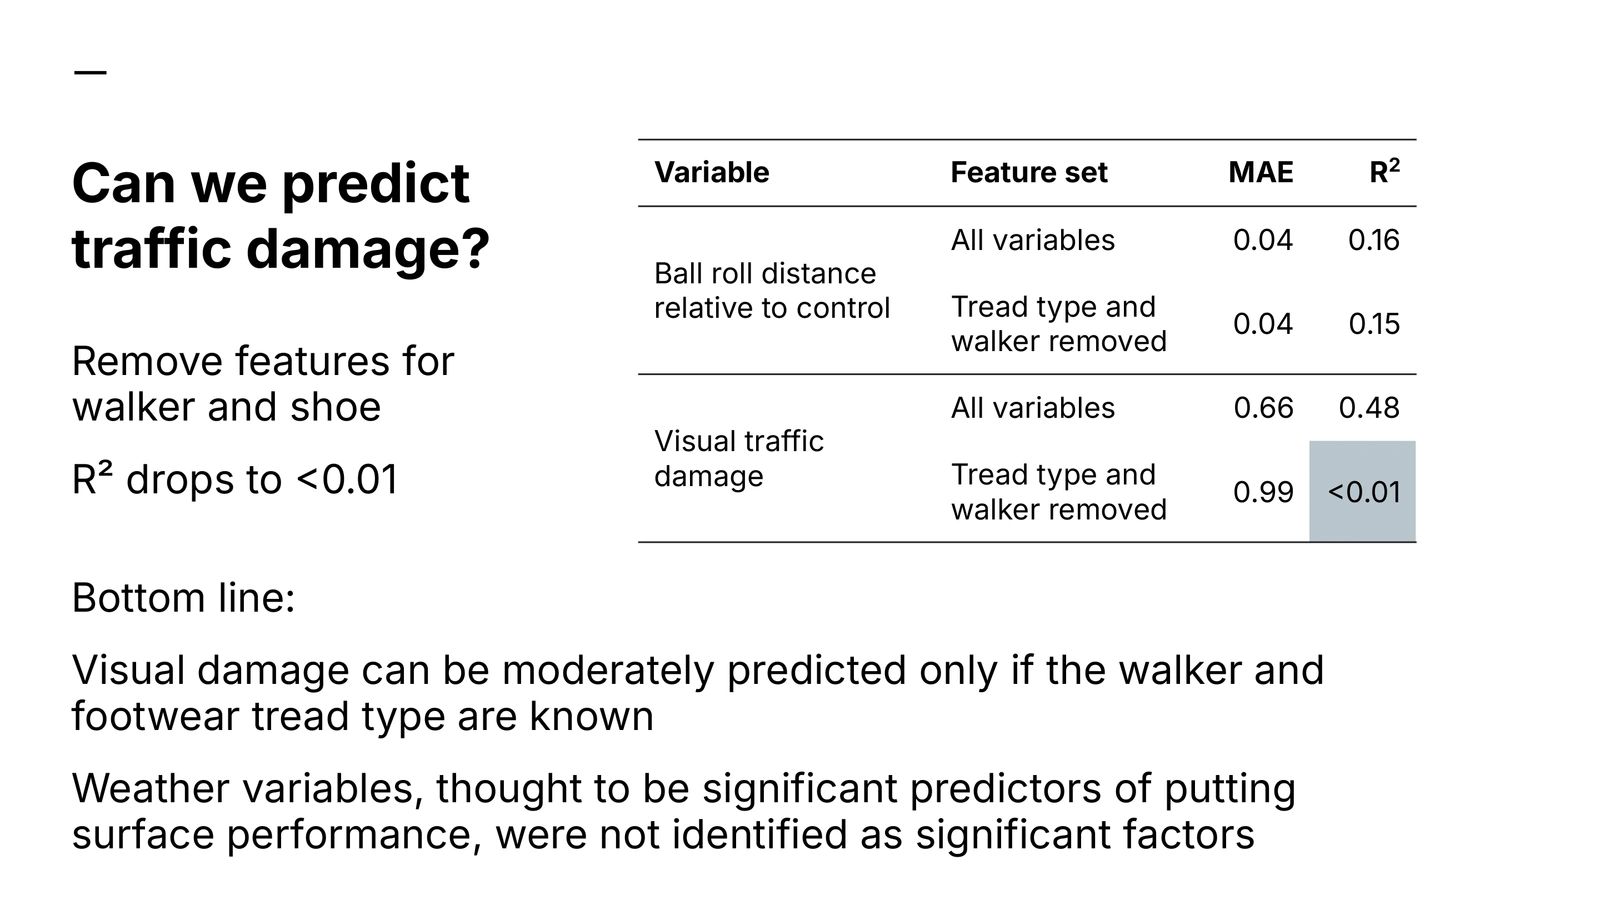
Like we did with the first models, we wanted to see if we take out the walker identity and shoe type features, can we predict damage that would occur? If we do that our R² drops to less than 0.01. This is nothing, just noise. In our dataset the weather, soil moisture, surface firmness, grass type, and so on can’t predict putting surface damage.
The bottom line is that visual damage can be moderately predicted with our features, only if the walker and footwear tread type are included.
Slide 17
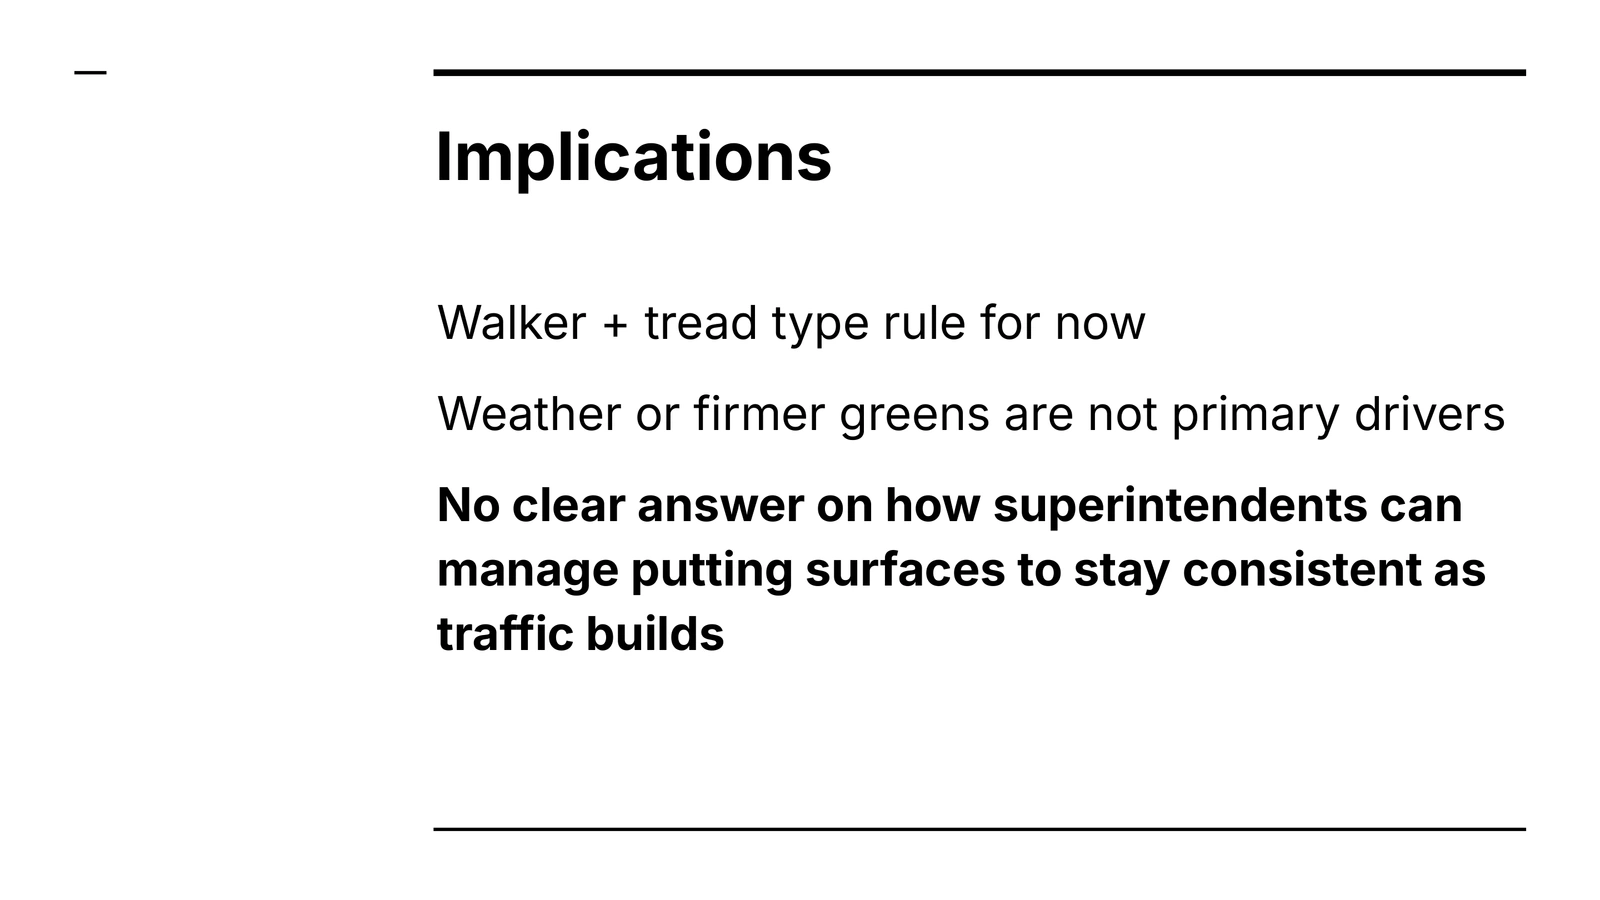
Weather conditions and surface conditions, which superintendents could manage, are not primary drivers of putting surface disruption. There is not necessarily more shoe damage after rainfall, nor is there more damage to firmer greens. At this point we have no clear guidance on how superintendents can manage putting surfaces to stay consistent as traffic builds.
Slide 18
Next steps are to identify controllable predictors and expand the geographic area. Cornell is expanding this work to test across many golf courses in New York state. They will also capture more detailed management practices like rolling frequency, mowing practices, plant growth regulator use, and organic matter levels.
Slide 19
This research was made possible by the Cornell team, all the walking participants, and FootJoy.
Thank you to Carl Schimenti for providing helpful feedback on these slides. Carl is also the lead author on the published paper.