Benchmarking golf course irrigation with the USGA water model
The USGA water model provides a surprisingly good benchmark estimate of golf course water demand. Here’s how it works and why it matters. Try the interactive map to see the irrigation requirements for Minnesota and Wisconsin.
Golf course water use models
Golf course superintendents need reliable benchmarks for planning irrigation capacity and measuring water efficiency. A new paper by Bekken et al. tested several water use models against actual data from 71 golf courses in the United States. In the Midwest, Northeast, and Northwest regions, the USGA model came closest to observed water use. This is surprising. The USGA model was the simplest one evaluated, using only evapotranspiration minus rainfall. The authors note that more complex models with soil texture, rooting depth, and solar radiation are needed for other climates.
Benchmark, then diagnose variance
The model isn’t perfect and there is variation. Midwest golf courses use on average 89% of the water the USGA model predicts. Most of these courses range from 38% to 140% of the modeled requirement. A golf course superintendent can start with these modeled benchmarks and then diagnose why their actual water usage would be different.
Irrigated area
Irrigated area creates the biggest discrepancy in model outcomes. Many golf courses don’t know their actual irrigated acreage. It’s not the exact geometry of greens, tees, or fairways because irrigation heads overthrow beyond that area. This quote from the paper explains it well:
“Estimating irrigated area accurately, especially in roughs, is incredibly important for all models to predict golf course water requirements. However, most superintendents in our study did not have a detailed understanding of the amount of area in the rough being irrigated.”
The authors took the exact geometry of greens, tees, and fairways and estimated overthrow into roughs. Their calculation ends up doubling the irrigated area of greens and increases fairway area by 50%. It makes a big difference in total water requirements.
Minnesota and Wisconsin patterns
Now let’s try this out. Enter your irrigated area and select a location in Minnesota or Wisconsin. The map computes irrigation requirements using 10 years of climate data (2015-2024) and the USGA formula. Compare your usage. Is it more or less?
Minnesota and Wisconsin golf course irrigation calculator
Enter your irrigated acres to see projected irrigation requirements.
The USGA model uses this equation: Irrigation requirement = (Kc × ET₀) - (Re × R)
Where:
- Kc = 0.8 is the crop coefficient for cool-season turfgrass
- ET₀ is the reference evapotranspiration
- Re = 0.5 is the effective rainfall coefficient (assumes 50% of rainfall is effectively used by the turfgrass)
- R is the rainfall
More simply: Irrigation requirement = ET for cool season turfgrass - effective rainfall
Effective rainfall is the portion of rainfall that gets stored in the root zone and available for plant use. Imagine an intense rainfall event. Some water runs off the surface, some drains past the root zone in sandy soils. The USGA model assumes 50% of rainfall is effective rainfall. The aforementioned Bekken et al. paper recommends lowering this to 20% for climates like Florida. Lower effective rainfall increases irrigation needs.
Example
I found water use data from two Minnesota golf courses in a stormwater reuse case study. Eagle Valley Golf Course in Woodbury, MN used 30 million gallons annually on 60 acres. The USGA model estimate for that area and climate is 21.65 million gallons for an average year, so the golf course used 139% of the benchmark. Prestwick Golf Course used 35 million gallons annually on 75 acres. The model estimate is 27.06 million gallons, so observed use was 129% of the benchmark. Both courses fall within the water efficiency range researchers found (38% to 140% of modeled requirement) but are on the higher end.
The year-to-year variation in irrigation needs is clear when comparing recent drought and wet years.
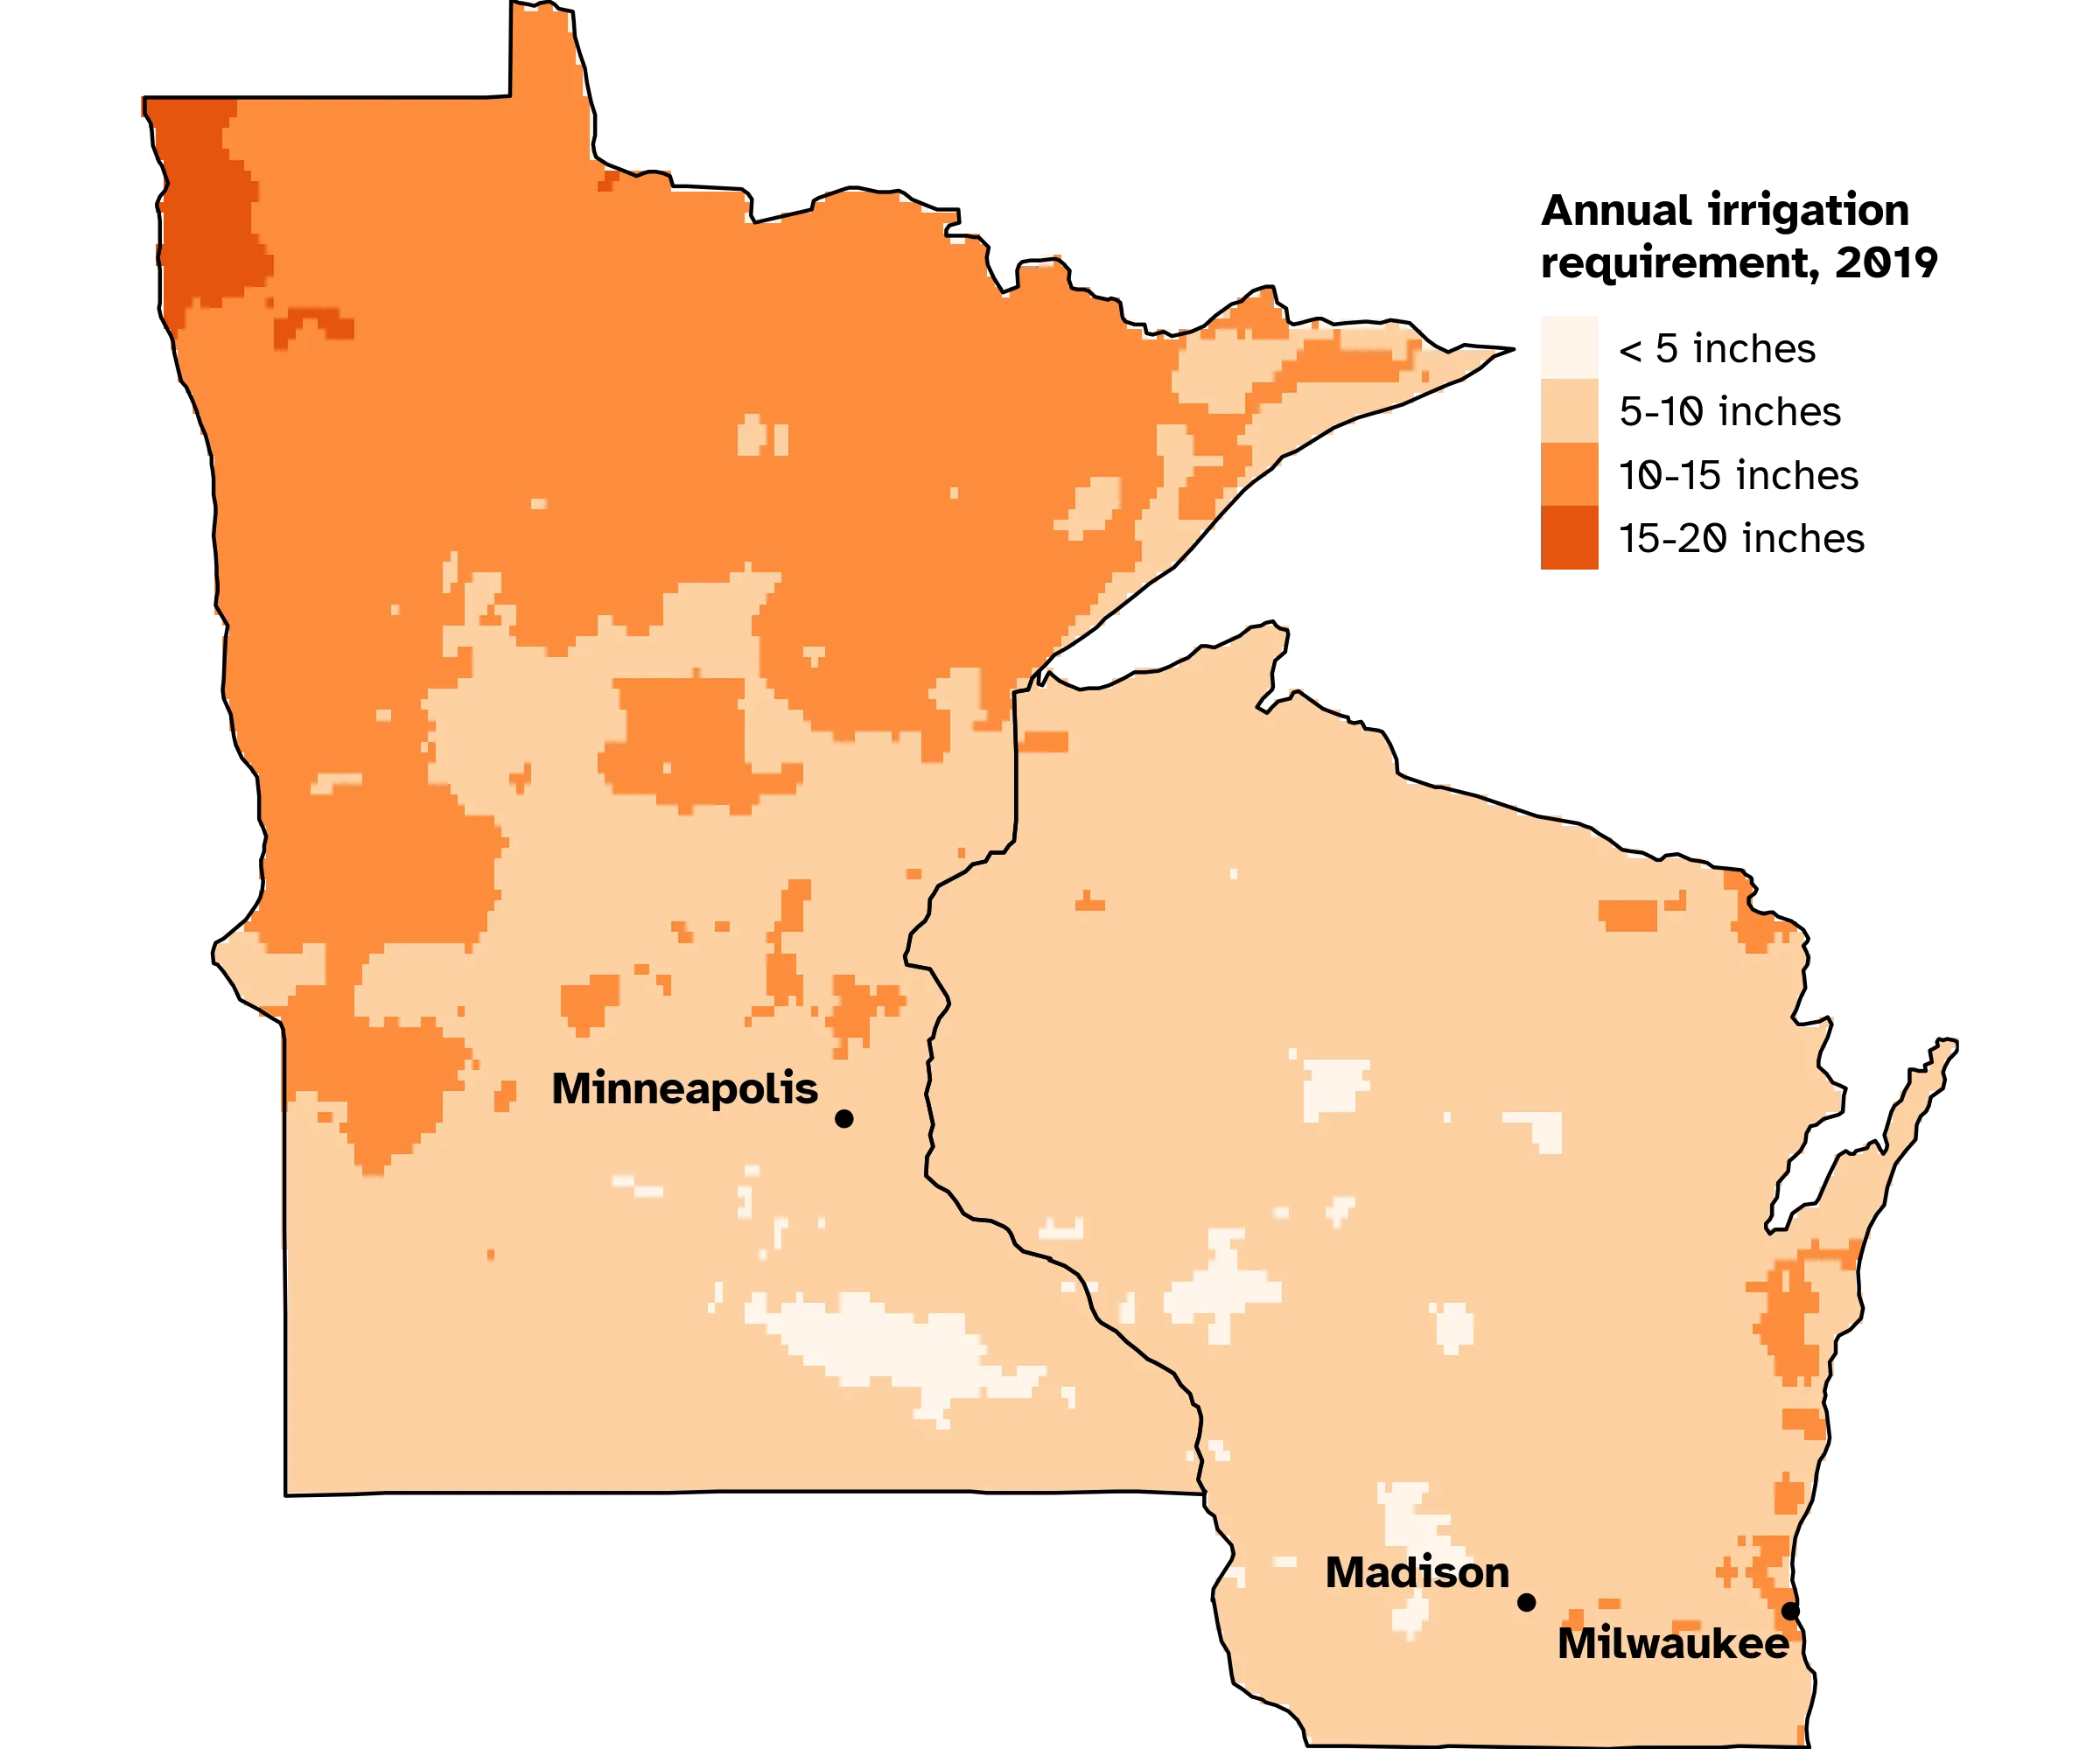
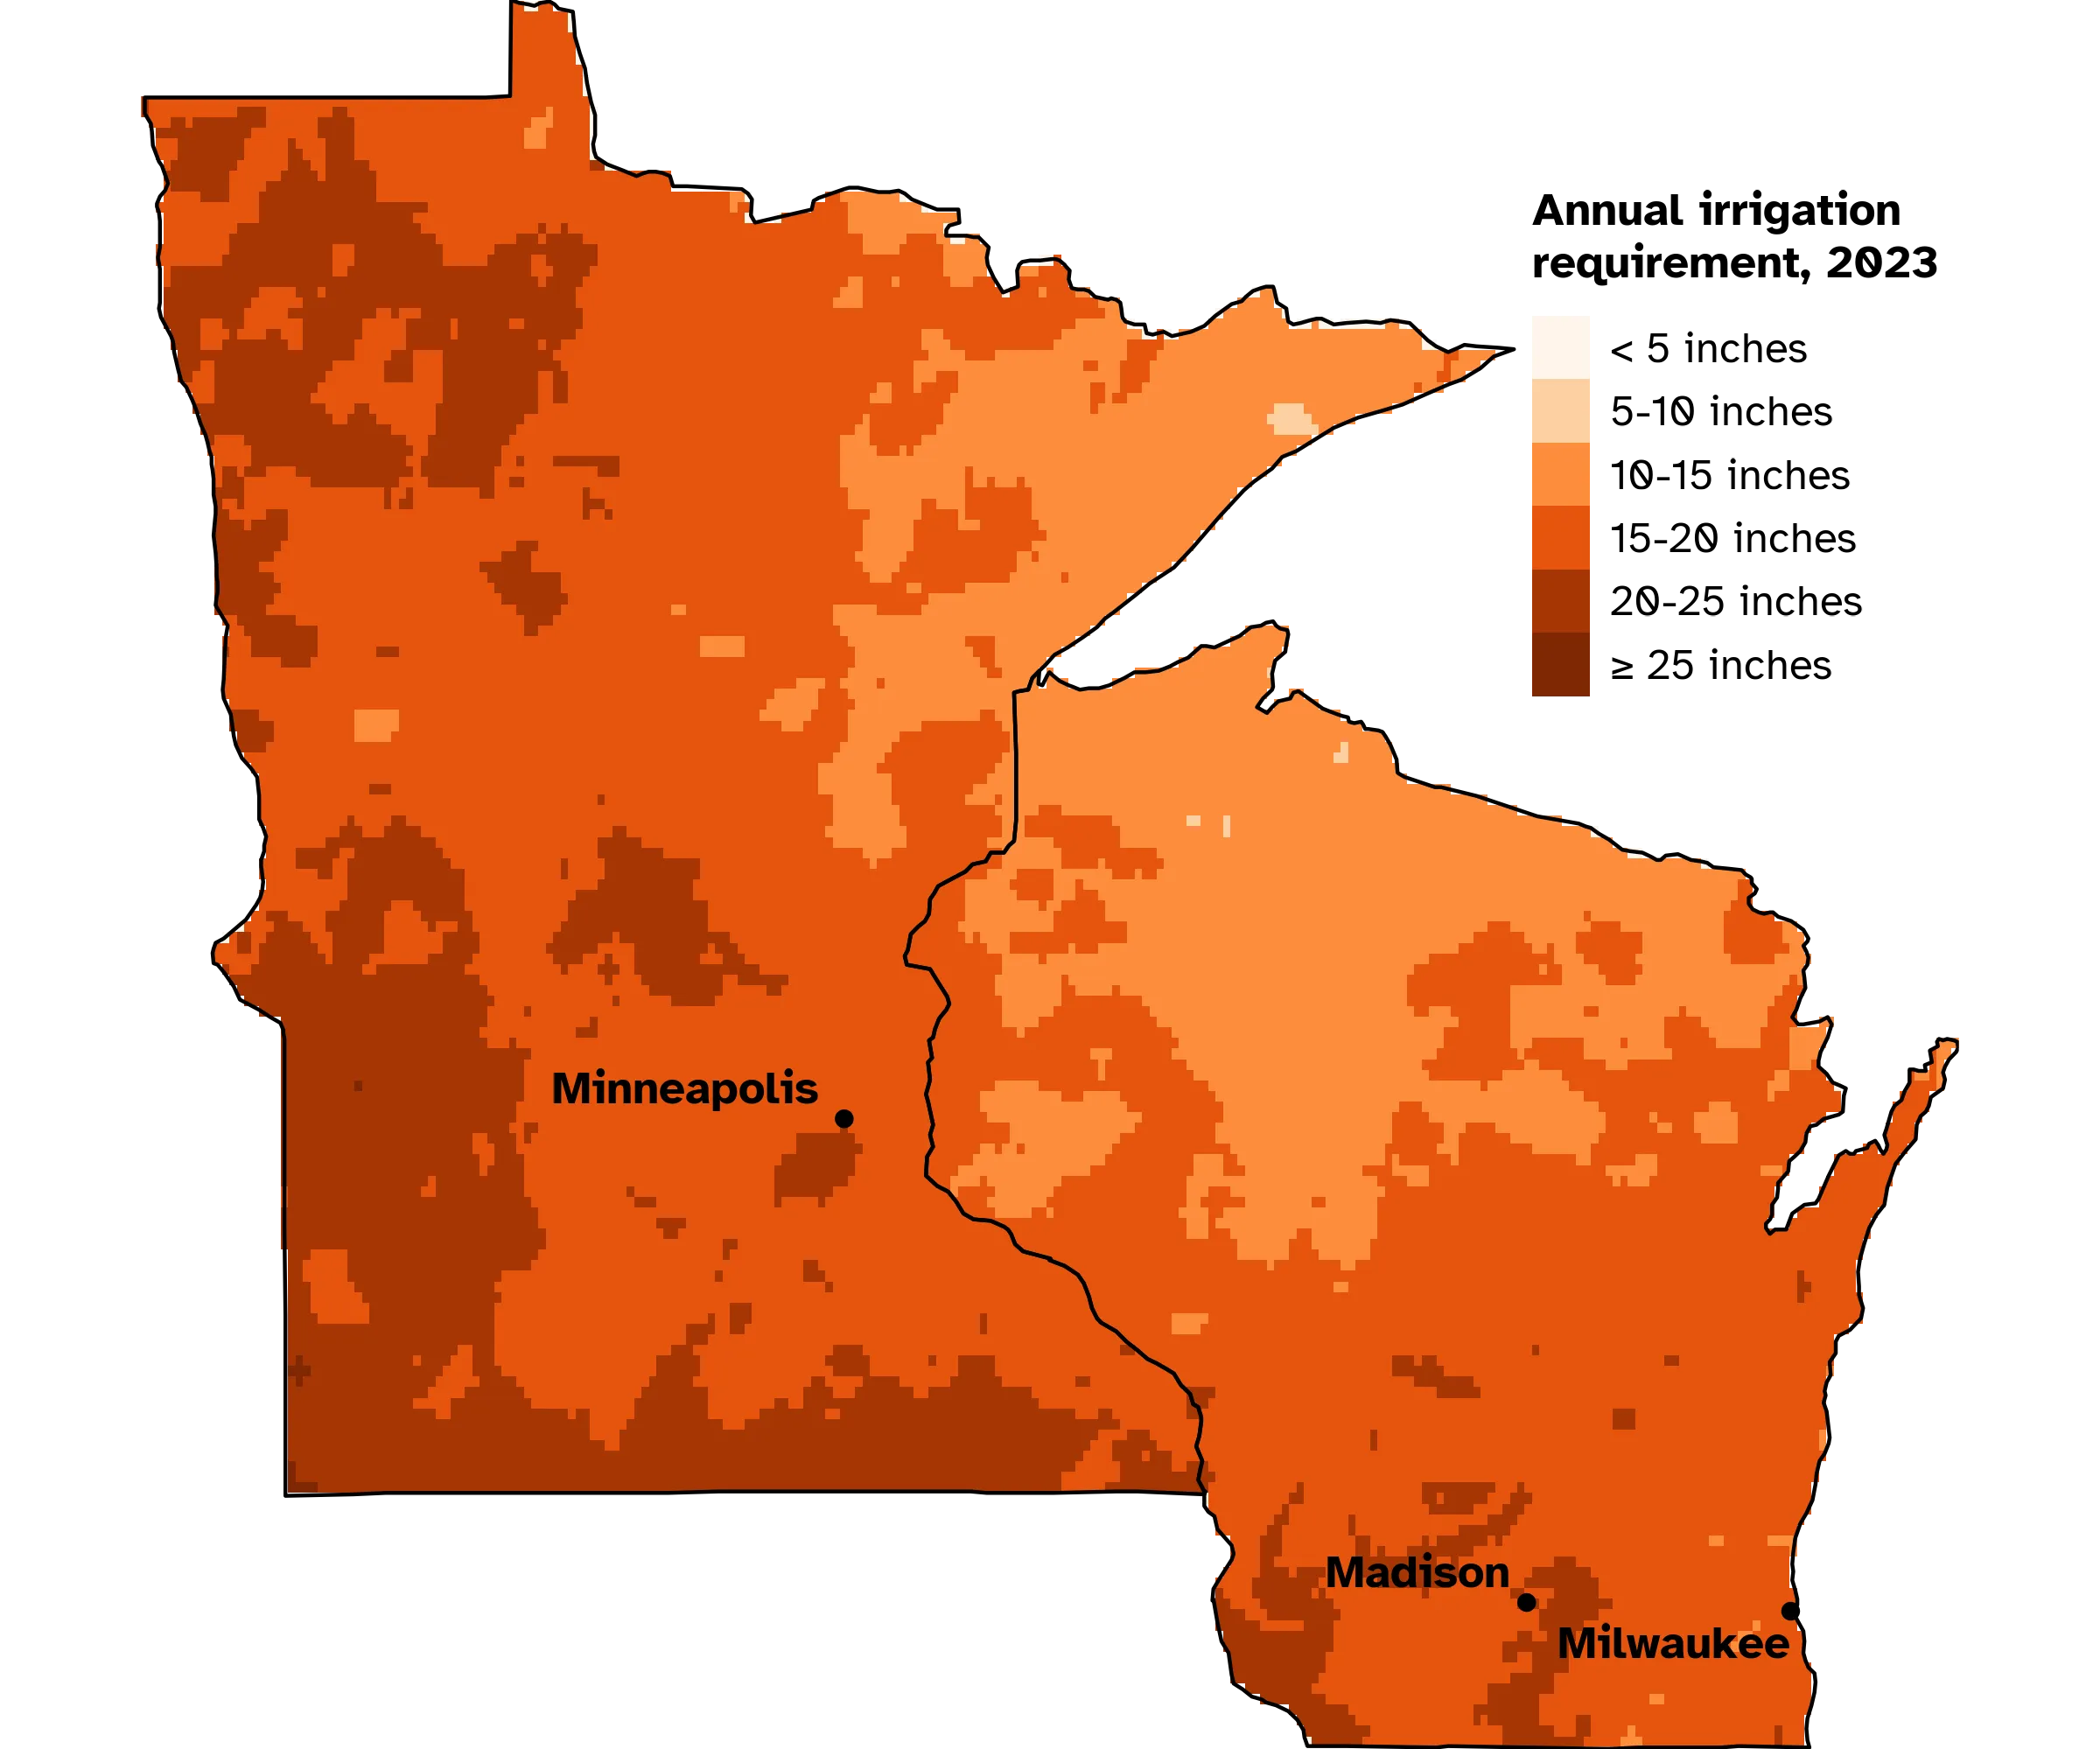
The maps above show the USGA model for Minnesota and Wisconsin, in inches per year. For Madison, WI, a dry year like 2023 required about 20 inches to irrigate a golf course, while a wet year like 2019 needed only about 9 inches. Use this data to design infrastructure and budgets for drought years with higher irrigation demand, not just average conditions.
Learn more
The USGA model gives superintendents a data-driven starting point for water management decisions and planning. Frame your actual water use relative to these benchmarks, like “We use 10% more than the USGA model.” Remember to check irrigated area assumptions first.
Once you have your benchmark comparison, the next step is optimization. The USGA Water Conservation Playbook covers water management strategies for golf courses. This new resource from the USGA has everything you could possibly think of. It provides validated numbers on water savings from different management practices, plus case studies across different climates and budgets. It’s really well done and free to access.